Ranking Every State by Public School Enrollment Loss Since 2019: See Where Your State Stands, and Which Eight Bucked the National Decline.
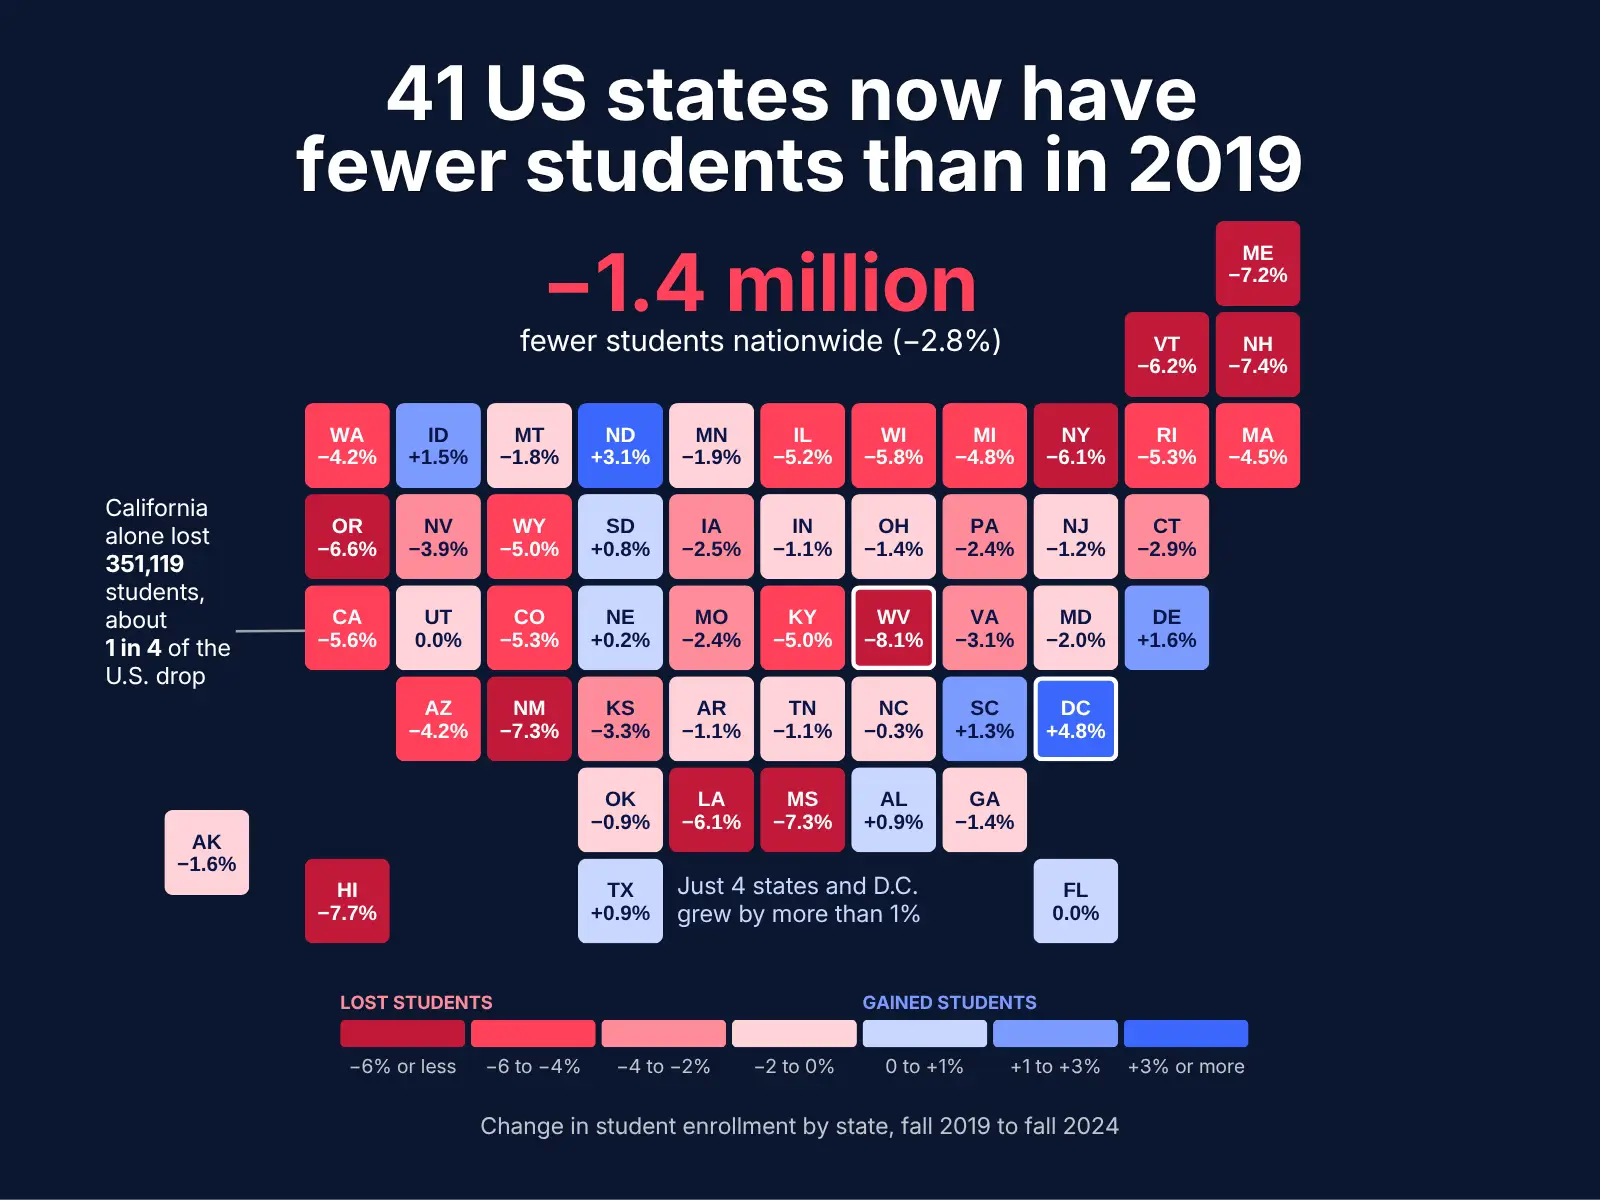
The state that lost the most students, California, had about a quarter of the national decline. California's percentage decline (5.6%) is 2.5 percentage points smaller than West Virginia's (8.1%), which had the highest.
Key Takeaways
- California lost the most students, 351,119, about a quarter of the national decline, but ranked only 12th by percentage.
- West Virginia lost the largest share, 8.1%, nearly three times the national rate of 2.8%.
- Eight states, along with Washington, D.C., gained students, led by North Dakota at 3.1% and D.C. at 4.8%.
Which States’ Public Schools Fell the Hardest
West Virginia lost 8.1% of its public school students between the fall of 2019 and 2024. This was the highest decline in the country. Hawaii was second with a 7.7% decline, while New Hampshire was third. North Dakota is at the other end of the spectrum, gaining 3.1%. Washington, D.C., not a state, gained the most students, 4.8%.
Countrywide, the enrollment declined by 2.8%. 10 states lost more than 6% of their students, while 4 gained more than 1%, along with Washington, D.C.

| Rank | State | Fall 2019 | Fall 2024 | % Change |
| 1 | West Virginia | 263,486 | 242,155 | -8.1% |
| 2 | Hawaii | 181,088 | 167,071 | -7.7% |
| 3 | New Hampshire | 177,351 | 164,153 | -7.4% |
| 4 | Mississippi | 466,002 | 431,864 | -7.3% |
| 5 | New Mexico | 331,206 | 307,110 | -7.3% |
| 6 | Maine | 180,291 | 167,309 | -7.2% |
| 7 | Oregon | 610,648 | 570,233 | -6.6% |
| 8 | Vermont | 86,759 | 81,398 | -6.2% |
| 9 | New York | 2,692,589 | 2,527,258 | -6.1% |
| 10 | Louisiana | 710,439 | 666,840 | -6.1% |
| 11 | Wisconsin | 855,400 | 806,065 | -5.8% |
| 12 | California | 6,249,005 | 5,897,886 | -5.6% |
| 13 | Rhode Island | 143,557 | 135,978 | -5.3% |
| 14 | Colorado | 913,223 | 865,077 | -5.3% |
| 15 | Illinois | 1,943,117 | 1,842,881 | -5.2% |
| 16 | Kentucky | 691,996 | 657,263 | -5.0% |
| 17 | Wyoming | 94,616 | 89,915 | -5.0% |
| 18 | Michigan | 1,495,925 | 1,423,933 | -4.8% |
| 19 | Massachusetts | 959,394 | 915,932 | -4.5% |
| 20 | Arizona | 1,152,586 | 1,103,894 | -4.2% |
| 21 | Washington | 1,142,073 | 1,094,502 | -4.2% |
| 22 | Nevada | 496,934 | 477,563 | -3.9% |
| 23 | Kansas | 497,963 | 481,626 | -3.3% |
| 24 | Virginia | 1,297,012 | 1,257,315 | -3.1% |
| 25 | Connecticut | 523,690 | 508,402 | -2.9% |
| 26 | Iowa | 517,324 | 504,292 | -2.5% |
| 27 | Pennsylvania | 1,732,449 | 1,691,456 | -2.4% |
| 28 | Missouri | 910,466 | 889,059 | -2.4% |
| 29 | Maryland | 909,404 | 891,525 | -2.0% |
| 30 | Minnesota | 893,203 | 876,182 | -1.9% |
| 31 | Montana | 149,917 | 147,208 | -1.8% |
| 32 | Alaska | 132,017 | 129,876 | -1.6% |
| 33 | Ohio | 1,689,867 | 1,665,566 | -1.4% |
| 34 | Georgia | 1,769,657 | 1,744,662 | -1.4% |
| 35 | New Jersey | 1,411,917 | 1,394,971 | -1.2% |
| 36 | Arkansas | 496,927 | 491,239 | -1.1% |
| 37 | Tennessee | 1,014,744 | 1,003,622 | -1.1% |
| 38 | Indiana | 1,051,411 | 1,040,190 | -1.1% |
| 39 | Oklahoma | 703,719 | 697,358 | -0.9% |
| 40 | North Carolina | 1,560,350 | 1,555,418 | -0.3% |
| 41 | Utah | 684,694 | 684,604 | 0.0% |
| 42 | Florida | 2,858,461 | 2,859,600 | 0.0% |
| 43 | Nebraska | 330,018 | 330,622 | 0.2% |
| 44 | South Dakota | 139,949 | 141,065 | 0.8% |
| 45 | Texas | 5,495,398 | 5,545,640 | 0.9% |
| 46 | Alabama | 744,235 | 751,060 | 0.9% |
| 47 | South Carolina | 786,879 | 796,780 | 1.3% |
| 48 | Idaho | 311,096 | 315,626 | 1.5% |
| 49 | Delaware | 139,930 | 142,156 | 1.6% |
| 50 | North Dakota | 116,185 | 119,792 | 3.1% |
| 51 | District of Columbia | 89,878 | 94,211 | 4.8% |
Source: NCES Digest of Education Statistics 2025, table 203.20. States ranked from hardest decline to strongest gain. D.C. is listed separately and excluded from the state ranking. Figures are rounded to one decimal place.
Of the 50 states, 8 actually gained students, plus Washington, D.C.
The Pattern in the Numbers
The regions with the steepest decline are spread across the country. Appalachia (West Virginia), New England (New Hampshire, Maine, Vermont), the Pacific (Hawaii, Oregon), the South (Mississippi, Louisiana), and the Mid-Atlantic (New York). New Mexico is the only Southwestern state in the group. No single region accounts for the pattern.
The Bottom of the Rankings
Four states and Washington, D.C., gained more than 1%. These are North Dakota, Delaware, Idaho, South Carolina, and Washington, D.C.
North Dakota is the only state with more than a 2% increase. Washington, D.C., while not a state, also gained more than 2%.
The Absolute Ranking Tells a Different Story
While percentage change matters, the numbers tell another story. The percentage change tells us which states were hit hardest, but the numbers help us to understand where the most students disappeared.

| Rank | State | # Students Lost |
| 1 | California | -351,119 |
| 2 | New York | -165,331 |
| 3 | Illinois | -100,236 |
| 4 | Michigan | -71,992 |
| 5 | Wisconsin | -49,335 |
| 6 | Arizona | -48,692 |
| 7 | Colorado | -48,146 |
| 8 | Washington | -47,571 |
| 9 | Louisiana | -43,599 |
| 10 | Massachusetts | -43,462 |
Source: Calculated from data available at NCES Digest of Education Statistics 2025, table 203.20.
California lost about a quarter of the national decline, which stands at 1,409,042. However, when it comes to percentage decline, California falls at number 12. This is because in the fall of 2019, California had 6,249,005 students.
West Virginia lost 21,331 of its students, 6.1% of what California lost. Yet West Virginia lost the highest percentage of its student body. In West Virginia, that 8.1% represents a little over 8 students for every 100.
Texas, the outlier state, recorded a gain of 50,242 students.
How the Ranking is Shaping Up: New Data
The NCES data ends in fall 2024. NEA Research's Rankings of the States 2025 and Estimates of School Statistics 2026 (April 2026) project fall 2025 enrollment from state agency estimates. By that series, the decline has continued. The ten steepest projected declines from fall 2024 to fall 2025 are below. These are estimates, not counts, and they are a separate series from the NCES figures above.
| Rank | State | Change |
| 1 | Wyoming | −2.78% |
| 2 | New Mexico | −2.58% |
| 3 | West Virginia | −2.52% |
| 4 | Mississippi | −2.46% |
| 5 | Arizona | −2.37% |
| 6 | Florida | −2.33% |
| 7 | Connecticut | −2.09% |
| 8 | Wisconsin | −1.80% |
| 9 | Nevada | −1.74% |
| 10 | Georgia | −1.70% |
Methodology
The data include public and charter schools; private schools and homeschooled students are not included. The percentage change has been rounded to 1 decimal place.
Most Read



loading