Bankruptcy rates vary more than tenfold between US states. Here’s where yours ranks in 2026
• Finance
About 174 out of every 100,000 Americans filed for personal bankruptcy in the 12 months to September 2026, up from a record low four years ago, but still only a quarter of the rate in 2005 and below where it stood just before the pandemic.
Key takeaways
- The headline jump of 11% sounds dramatic. The long view tells a calmer story.
- In Alabama, people file at more than ten times the rate of Alaskans.
- Two of the biggest moves in the last 25 years had little to do with the economy.
Rising fast, from a very low starting point
The latest numbers from the federal courts made headlines for a reason. According to US Courts data released on October 22, 594,057 people filed for personal, or non-business, bankruptcy in the 12 months to September 30, 2026. That's 11.4% more than a year earlier, and filings have now risen every quarter since mid-2022.
But a raw count of filings can be misleading, because the country keeps growing. Dividing by the population gives a fairer comparison over time. On that measure, about 174 people per 100,000 filed in the latest 12 months.
That's well above the low point. In 2022, the rate fell to about 112 per 100,000, the lowest in decades. It's also above 2024, at about 145, and 2025, at about 161. So yes, bankruptcies are clearly climbing.
Put the same number next to the rest of the century, though, and it looks very different. In 2019, the last full year before the pandemic, the rate was about 229. In 2010, at the height of the financial crisis fallout, it was close to 500. And in 2005, it hit about 690, four times today's level. Even after four years of increases, Americans are filing for bankruptcy less often than they did during most of the 2000s and 2010s.
25 years of bankruptcies, in three big moments
The line from 2000 to today isn't a smooth curve. Three moments explain most of its shape, and only one of them was a classic economic crisis.
2005: the rush before the door closed
The highest point on the chart came from a change in the law. The Bankruptcy Abuse Prevention and Consumer Protection Act took effect on October 17, 2005. It added a means test, which made it harder for people with above-median incomes to wipe out their debts under Chapter 7, and it required credit counseling before filing.
People who had been thinking about bankruptcy rushed to file before the new rules kicked in. Personal filings topped 2 million that year, the most on record. Then they collapsed. In 2006, the rate fell from about 690 to about 200 per 100,000, a drop of more than two-thirds in a single year.
2010: the financial crisis catches up
The second peak was the one most people would expect. After the 2008 financial crisis, millions of Americans lost jobs and watched home values fall below what they owed on their mortgages. Filings climbed every year from 2007 to 2010, when the rate reached nearly 500 per 100,000. Counting business cases too, total filings peaked at nearly 1.6 million in the 12 months to September 2010.
From there, filings fell for more than a decade as the economy recovered and households paid down debt.
2022: the pandemic pause
Then came something unusual. When COVID-19 hit, unemployment shot up, yet bankruptcies fell sharply instead of rising. Stimulus checks, expanded unemployment benefits, pauses on evictions and student loan payments, and mortgage forbearance kept many struggling households out of court.
The rate dropped from about 229 per 100,000 in 2019 to about 112 in 2022. As that support wound down, filings started climbing again, and they've gone up every quarter since. Part of today's increase is simply a return toward normal after an artificially low point.
Where your state ranks
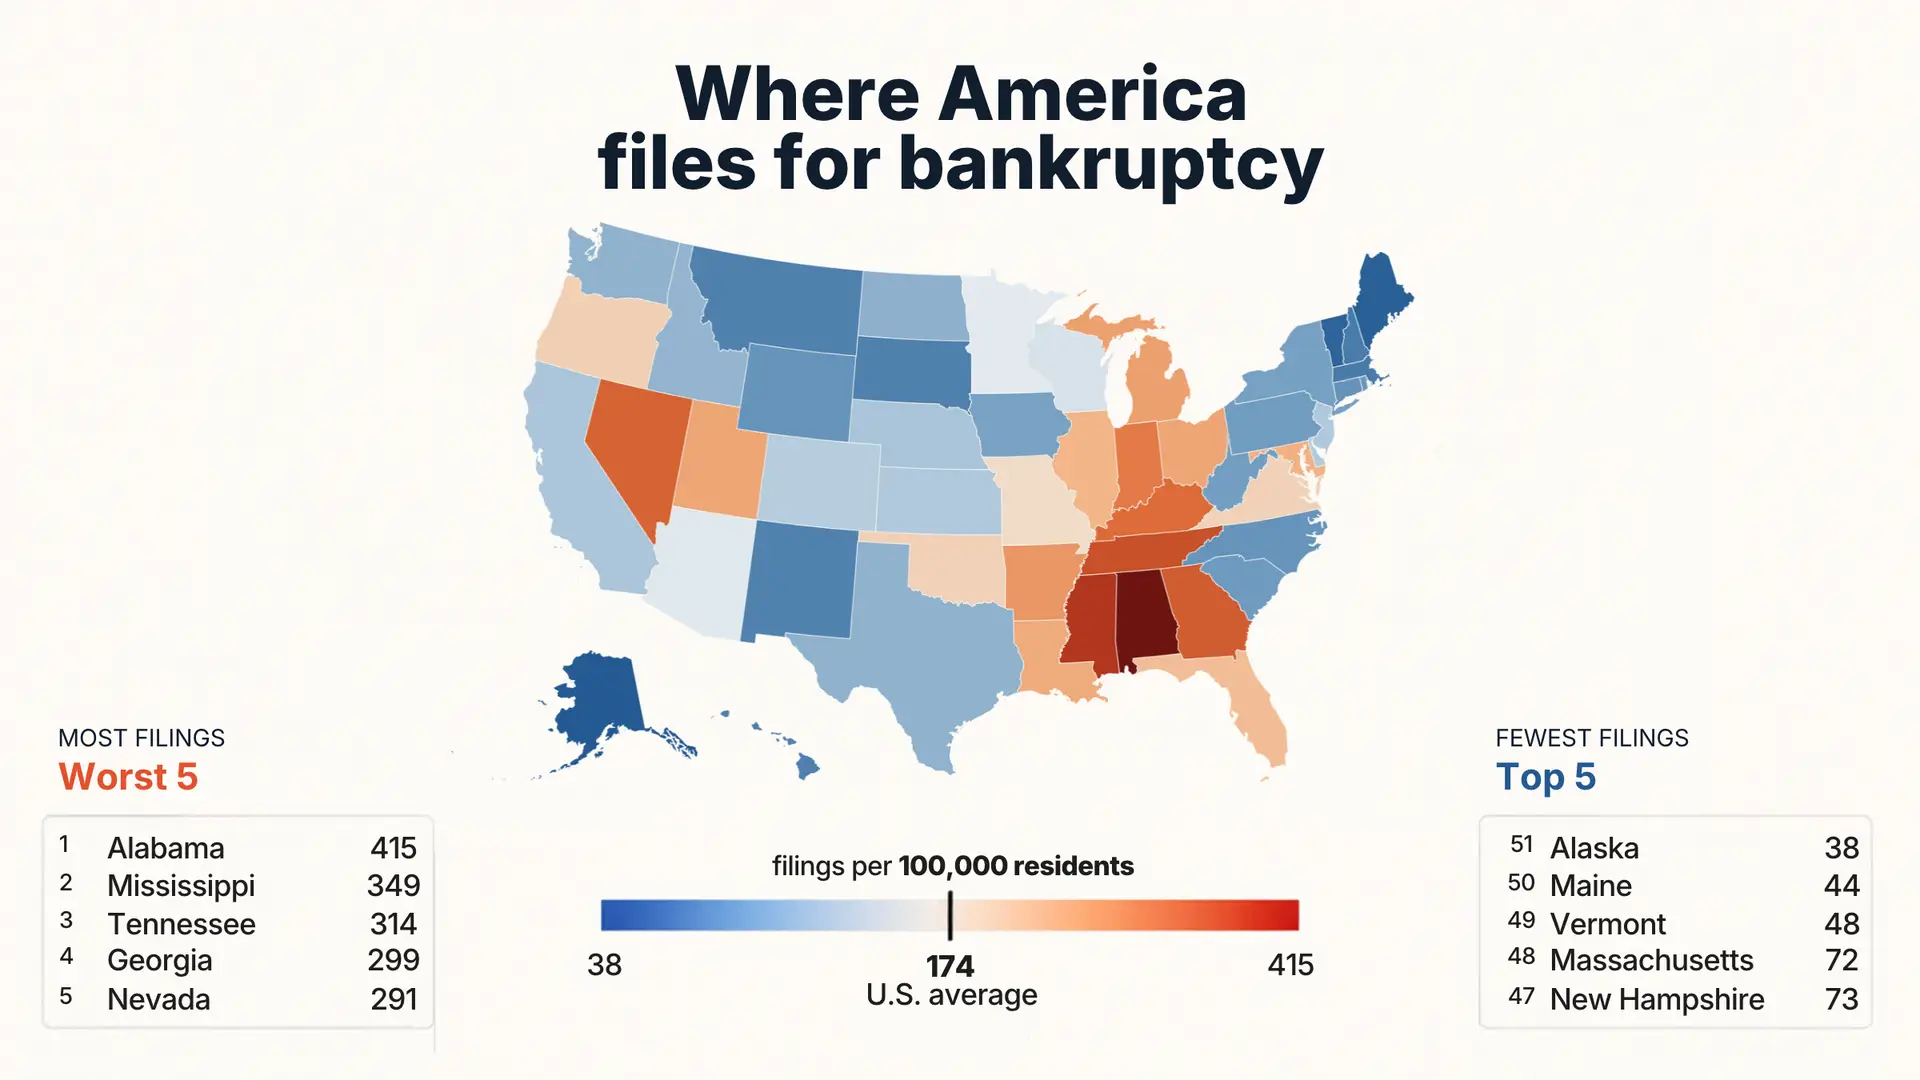
The national figure hides enormous differences from one state to the next. We added up the filings in every federal bankruptcy district for the 12 months to September 2026 and divided each state's total by its population.
The highest rates are clustered in the South:
- Alabama: about 415 filings per 100,000 people
- Mississippi: about 349
- Tennessee: about 314
- Georgia: about 299
- Nevada: about 291
The lowest are mostly in New England and the far north:
- Alaska: about 38 per 100,000
- Maine: about 44
- Vermont: about 48
- Massachusetts: about 72
- New Hampshire: about 73
That puts Alabama's rate at more than ten times Alaska's. Put another way, roughly one in every 240 Alabamians filed for bankruptcy in the past year, compared with about one in 2,600 Alaskans.
The Midwest has its own cluster of high rates, with Kentucky, Indiana, Michigan and Ohio all well above the national average of 174. The four biggest states are spread out. Florida, at about 207, sits above the national rate, while California, at about 141, Texas, at about 124, and New York, at about 108, all come in below it.
Why the South files so often
The Southern lead isn't new, and it isn't only about money. A big part of it comes down to the type of bankruptcy people file.
Most Americans who go bankrupt choose Chapter 7, which wipes out most debts fairly quickly. In much of the South, Chapter 13 is far more common. It sets up a repayment plan, usually over three to five years, and lets people keep things like a house or a car while they pay.
In a 2019 piece from the Federal Reserve Bank of St. Louis, William Rule, a senior economist at the Administrative Office of the US Courts, offered several possible reasons. Seasonal work and uneven wages are more common in the South, which can make a repayment plan a better fit. Harsher wage garnishment laws can push workers toward a plan rather than risk losing part of every paycheck. And Chapter 13 appears to be taught more often in Southern law schools.
The roots go back almost a century. The wage-earner plan that became Chapter 13 grew out of Depression-era practice in Alabama and was written into federal law in 1938 by a congressman from Tennessee. Generations later, the same states still sit at the top of the map.
Methodology
All figures cover personal, or non-business, bankruptcy filings only. The latest numbers come from the US Courts Table F-2 for the 12 months ending September 30, 2026. Where a state has more than one federal bankruptcy district, we added the districts together. State rates divide those filings by the Census Bureau's July 1, 2025 population estimates and multiply by 100,000. Yearly figures from 2000 to 2025 are calendar-year filings from US Courts data, divided by the US population for each year. The latest 12 months don't line up with a calendar year, so they're shown as their own period.
Most Read



loading