Each 2022 midterm ballot cost $91, 79% more than in 2002 after inflation
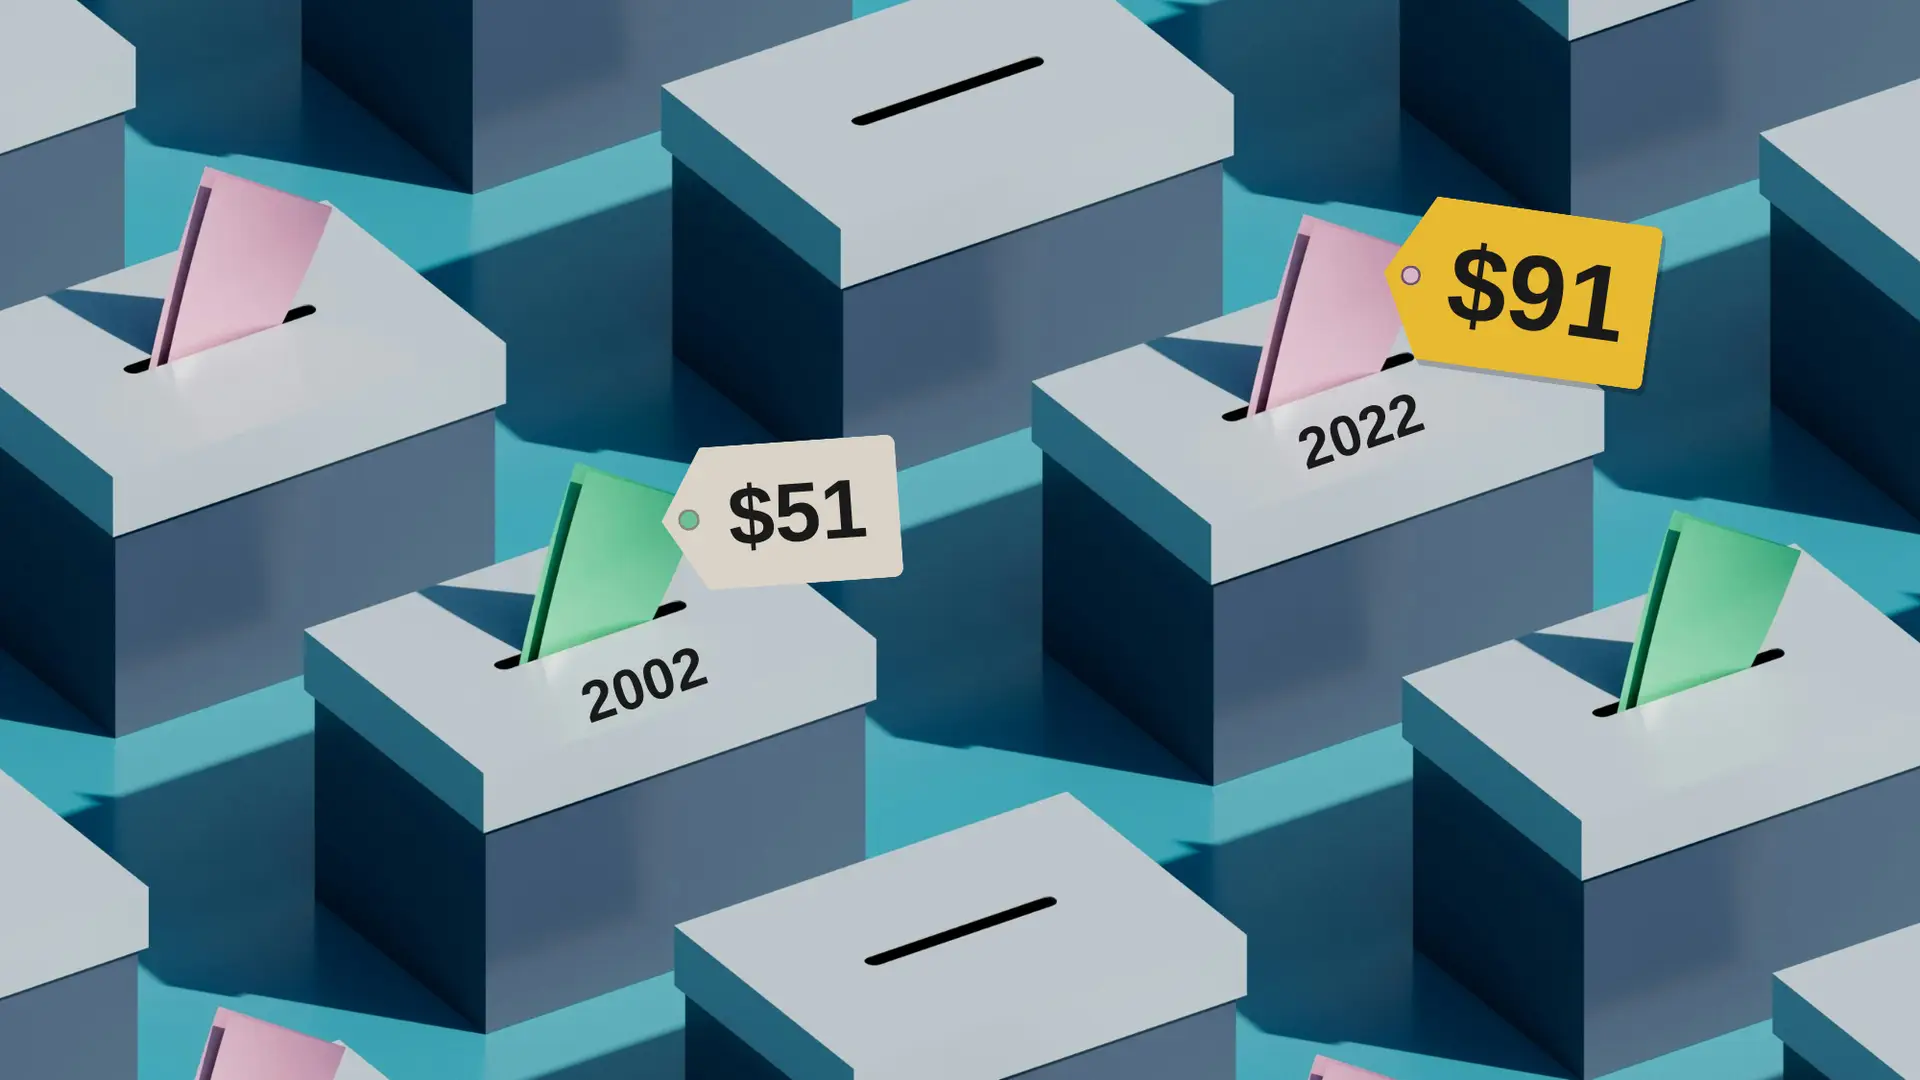
Midterm campaign spending reached new records in 2022, even though 2018 saw a higher turnout. What will the 2026 election bring?
Key takeaways
- The 2022 midterms cost about $91 of federal campaign spending per ballot cast, after inflation.
- That’s a 79% increase from $51 in 2002.
- The biggest jump so far came between 2018 and 2022, with an increase of about 41% in the cost per ballot.
One ballot vs. one tank of gas
On October 26, 2026, gasoline in the US cost $4.269 per gallon. For a 15-gallon tank, the cost comes up to about $64.
One 2022 ballot cost as much as 1.4 full tanks at today’s pump price. In 2002, it was 0.8 of a tank.
Of course, no one pays this sum for their vote. But this is real money spent by candidates, parties, and groups, divided by the number of ballots cast.
A slow climb, a dip, then a jump
The cost per ballot rose steadily between 2002 and 2010—from $51 to $62, growing between $4 and $7 each campaign. In 2014, it reached $66, even though real spending was slightly lower than in 2010, because fewer ballots were cast. Turnout was the lowest of the six cycles: just 36.6% of eligible voters turned out.
Then 2018 brought record spending of $7.68 billion in today’s dollars. But the cost per ballot actually dropped to $65, because turnout rose sharply to 50%.
Spending rose again in 2022, to $10.2 billion, a 33% increase after inflation. However, the number of ballots fell from 118.6 million to 112 million. As a result, the cost per ballot jumped $26, to $91.
The total spending tells one story. But the 2014 and 2018 trends were driven mainly by turnout, not by money. The cost per ballot changes the narrative.

Inflation-adjusted campaign spending per midterm ballot rose from $51 in 2002 to $91 in 2022
Money and turnout
Between 2002 and 2022, total federal midterm spending grew from $2.18 billion to $8.86 billion. After inflation, that’s $4.08 billion to $10.2 billion in today’s dollars—a 150% increase. The turnout rate rose from 40.5% to 46.1%, with a 50% high in 2018.
The bottom line: spending grew about 3.8 times faster than the number of ballots cast (150% vs. 40%). If only 80.3 million ballots had been cast in 2022, the cost per ballot would have been about $127.
Who spends the money
| Spender | 2002 | 2022 | Real increase |
| House and Senate candidates | $1.75B | $4.29B | +145% |
| Political parties | $2.12B | $2.48B | +17% |
| Outside groups | $32M | $2.60B | +8,025% |
Adjusted for inflation. Figures come from separate breakdowns, so they don’t add up to the annual total.
Midterm election money is spent by candidates, parties, and outside groups (PACs and super PACs). The spending by the candidates grew by 145%, while political parties increased theirs by just 17%, after inflation.
The biggest change is in outside groups. Their 8,025% jump followed three rule changes.
Three dates that changed the rules
- March 27, 2002: The Bipartisan Campaign Reform Act impedes national parties from raising soft money.
- January 21, 2010: The Supreme Court rules in Citizens United v. FEC. The government can no longer disallow corporations and unions from paying for independent political spending.
- March 26, 2010: In SpeechNow.org v. FEC, a federal appeals court rules that groups making only independent expenditures can accept unlimited contributions. This opens the way for super PACs.
In 2010, the first election after the two rulings, outside groups spent about $294 million, up from roughly $56 million in 2006 (Public Citizen, not adjusted for inflation).
What we know so far about 2026 midterms
The FEC reports that between January 1, 2025, and June 30, 2026, candidates spent $2.04 billion, and parties, $1.01 billion. Independent spending reached $643.4 million.
In the 2022 cycle, candidates had spent $1.76 billion in the same 18 months. Candidate spending is running 16% higher in nominal terms, or about 3% after inflation.
Election Day is Tuesday, November 3, and early voting is already underway in many states.
Methodology
“Spending” here means OpenSecrets’ total cost of congressional races: money spent by candidates, party committees and outside groups, such as PACs and super PACs, as reported to the FEC. Transfers between committees were counted once. OpenSecrets reports these figures in 2024 dollars (2024 CPI-U annual average: 313.689). We restate them in September 2026 dollars (CPI-U 336.940) by multiplying each figure by 336.940 / 313.689 (≈1.074).
Ballots: total ballots counted in each general election, from the UF Election Lab: 80.3 million (2002), 85.8 million (2006), 90.9 million (2010), 83.2 million (2014), 118.6 million (2018) and 112 million (2022). Cost per ballot is total spending divided by total ballots counted.
Inflation: BLS CPI-U, US city average. Gasoline: EIA weekly US regular retail price, week of October 26, 2026.
Sources
Most Read

loading