The East Coast gets the biggest Social Security checks, but the Midwest gets the most out of them
• Finance
Retirees in Mississippi receive the smallest average Social Security check in the country, $1,890 a month, according to the Social Security Administration. Retirees in New Jersey get one of the biggest, $2,288. Yet once local prices are counted, the Mississippi check buys more. Prices there are 13% below the national average, while New Jersey's are almost 9% above it.
The same pattern shows up across the map. Small checks in low-cost states often get you further than big checks in expensive ones.
Key takeaways
- Average retirement checks range from $1,890 in Mississippi to $2,308 in Connecticut (December 2025).
- By our estimate, adjusted for local prices, Mississippi's check is worth about $2,173, more than New Jersey's (about $2,103).
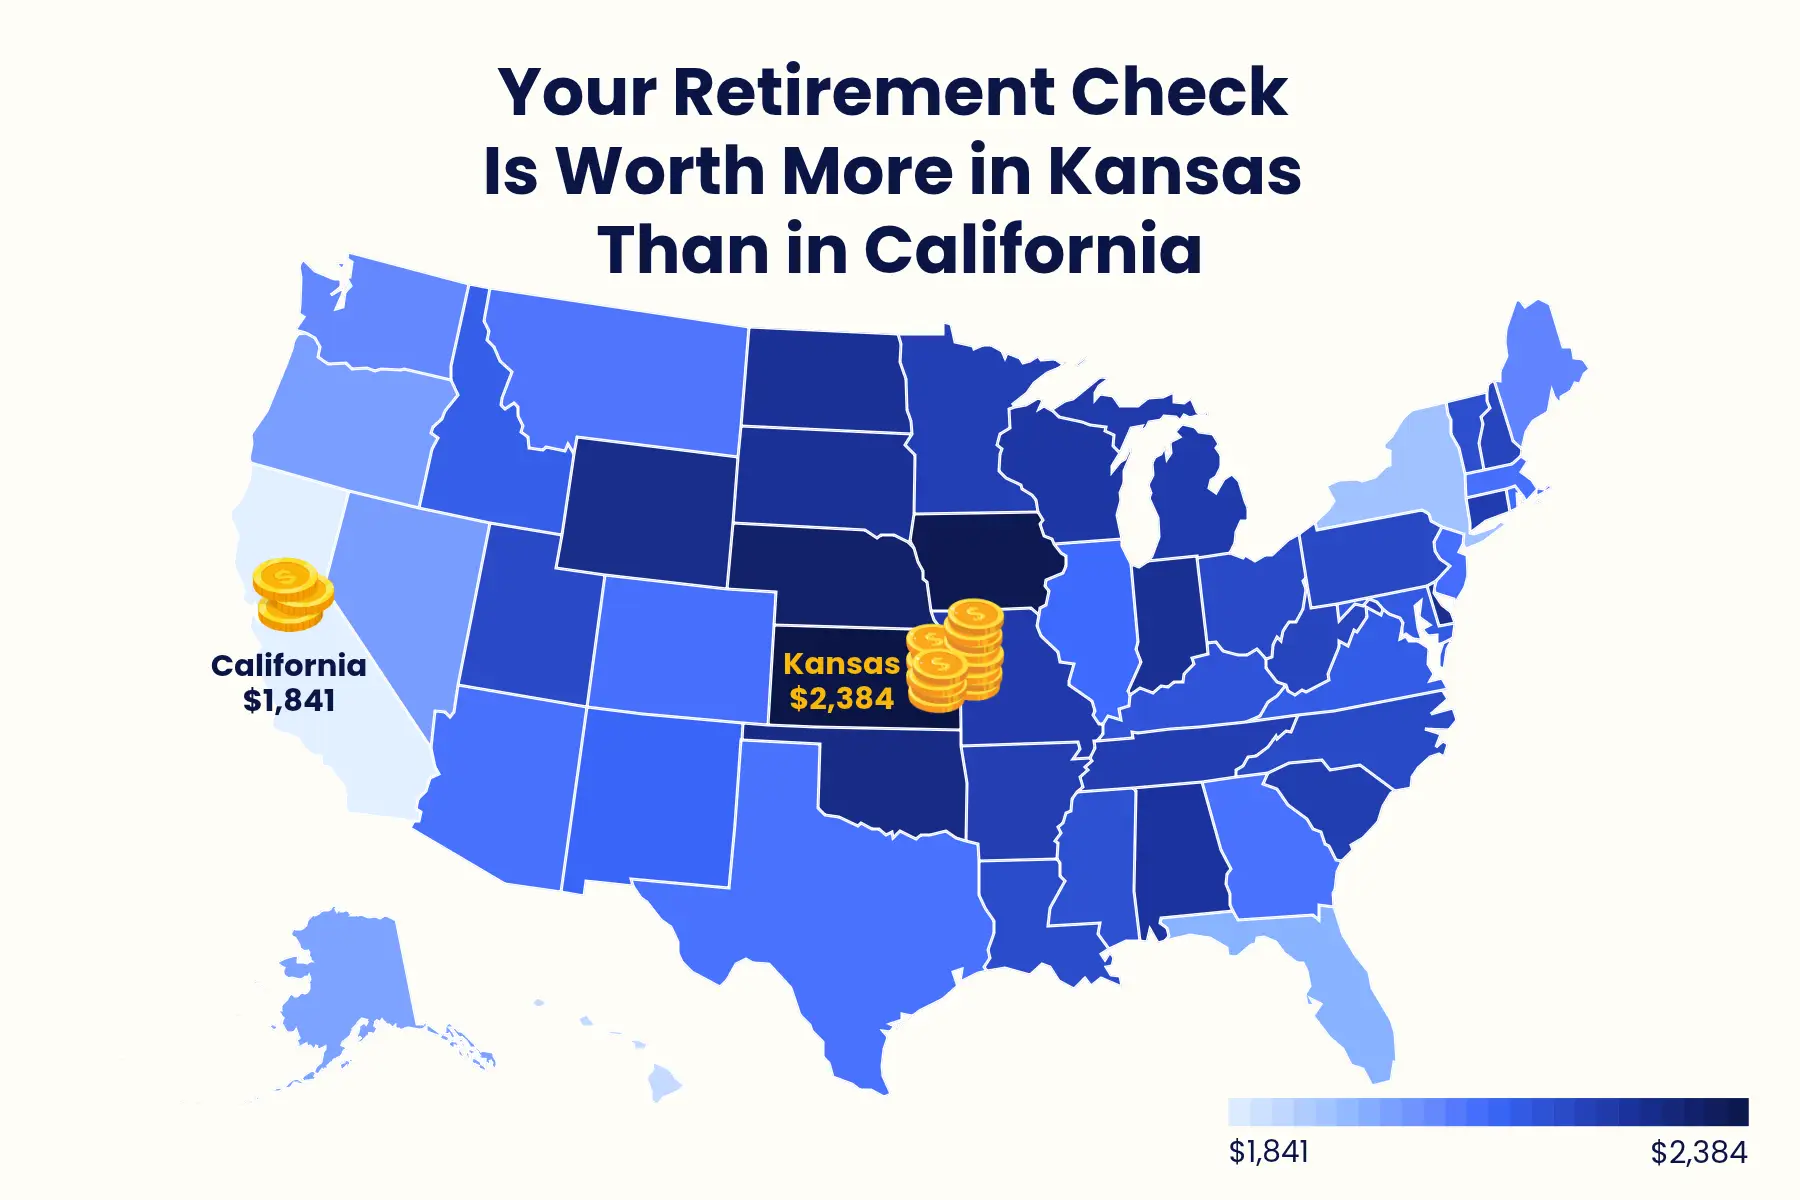
- California's check stretches the least of any state, worth about $1,841 at national prices.
- The 2027 raise adds about $75 a month to the average check nationally, but more dollars in states where checks are already bigger.
Where the checks are biggest and smallest

The national average for retired workers was $2,071 a month in December 2025. The biggest checks cluster in the Northeast and Mid-Atlantic, and the smallest mostly in the South.
| Biggest average checks | Per month | Smallest average checks | Per month |
| Connecticut | $2,308 | Mississippi | $1,890 |
| New Hampshire | $2,298 | Louisiana | $1,927 |
| New Jersey | $2,288 | Arkansas | $1,932 |
| Delaware | $2,274 | Kentucky | $1,953 |
| Maryland | $2,258 | New Mexico | $1,955 |
The gap between Connecticut and Mississippi is about $420 a month. That sounds large, but prices differ between states by much more than checks do.
A bigger check doesn’t mean more buying power

The Bureau of Economic Analysis measures how expensive each state is compared with the national average. In 2024, prices ranged from 13% below average in Arkansas and Mississippi to almost 11% above average in California.
Adjusting each state's average check for those prices, it changes the ranking completely. These are the states where the average check goes furthest and least far:
| Goes furthest | Worth at national prices (estimate) | Goes least far | Worth at national prices (estimate) |
| Kansas | $2,384 | California | $1,841 |
| Iowa | $2,368 | Hawaii | $1,892 |
| Nebraska | $2,332 | New York | $1,945 |
| Oklahoma | $2,287 | District of Columbia | $1,947 |
| Wyoming | $2,282 | Florida | $1,981 |
Some states move dramatically. Oklahoma ranks 41st by the size of its average check but 4th once prices are counted. New Jersey drops from 3rd to 35th, and Washington from 7th to 43rd. California is the standout at the bottom. Its average check, $2,038, is close to the national average, but by our estimate the state's high prices mean it buys less than a Mississippi check of $1,890.
What the 2027 raise adds
On October 14, the Social Security Administration announced a 3.6% cost-of-living adjustment for 2027, which takes effect with January payments. SSA estimates the average retired worker's check will rise from $2,095 to $2,170 a month, an increase of $75.
Because the raise is the same percentage everywhere, it adds more dollars where checks are already bigger. Applied to December 2025 averages, it is worth about $83 a month in Connecticut and about $68 in Mississippi. It doesn't change how far each check goes relative to local prices. Check out our article on how today's checks compare with the 1980s.
Why checks differ by state, and what that means for you
A Social Security benefit depends on two things: how much a person earned over their working life, and the age they started claiming. States with higher wages produce bigger average checks, which is why Connecticut, New Jersey and Maryland lead the list. The averages also reflect who lives where, since retirees often move after they stop working. Moving doesn't change anyone's benefit. A retiree who relocates from New Jersey to Mississippi keeps exactly the same check. The price-adjusted figures only show what the typical check in each state buys there, and they are averages. Your own costs depend on whether you rent, own your home outright or still have a mortgage.
Methodology
Average checks are the average monthly benefit for retired workers in each state as of December 2025, from the Social Security Administration's Annual Statistical Supplement 2026, Table 5.J6. State price levels are the Bureau of Economic Analysis's 2024 Regional Price Parities for all items, where the national average equals 100. These are the latest available, so the price data is one year older than the benefit data. The 2027 cost-of-living adjustment and the estimated average checks before and after it ($2,095 and $2,170) come from SSA, and the trust fund projection from the 2026 Trustees Report.
To estimate how far each check goes, we divided the state's average check by its price level. For example, Mississippi's average check ($1,889.72 before rounding) divided by 0.8695 (its price level of 86.95 / 100) is about $2,173.


loading

Loading