Electricity Prices Doubled Since 2001. But These 11 States Beat Inflation
• Finance
You may be paying more for electricity than you did 24 years ago, but depending on where you live, it could actually be cheaper after inflation.
Key Takeaways
- Electricity prices have doubled since 2001, but after adjusting for inflation, the nationwide increase is just 10.5%.
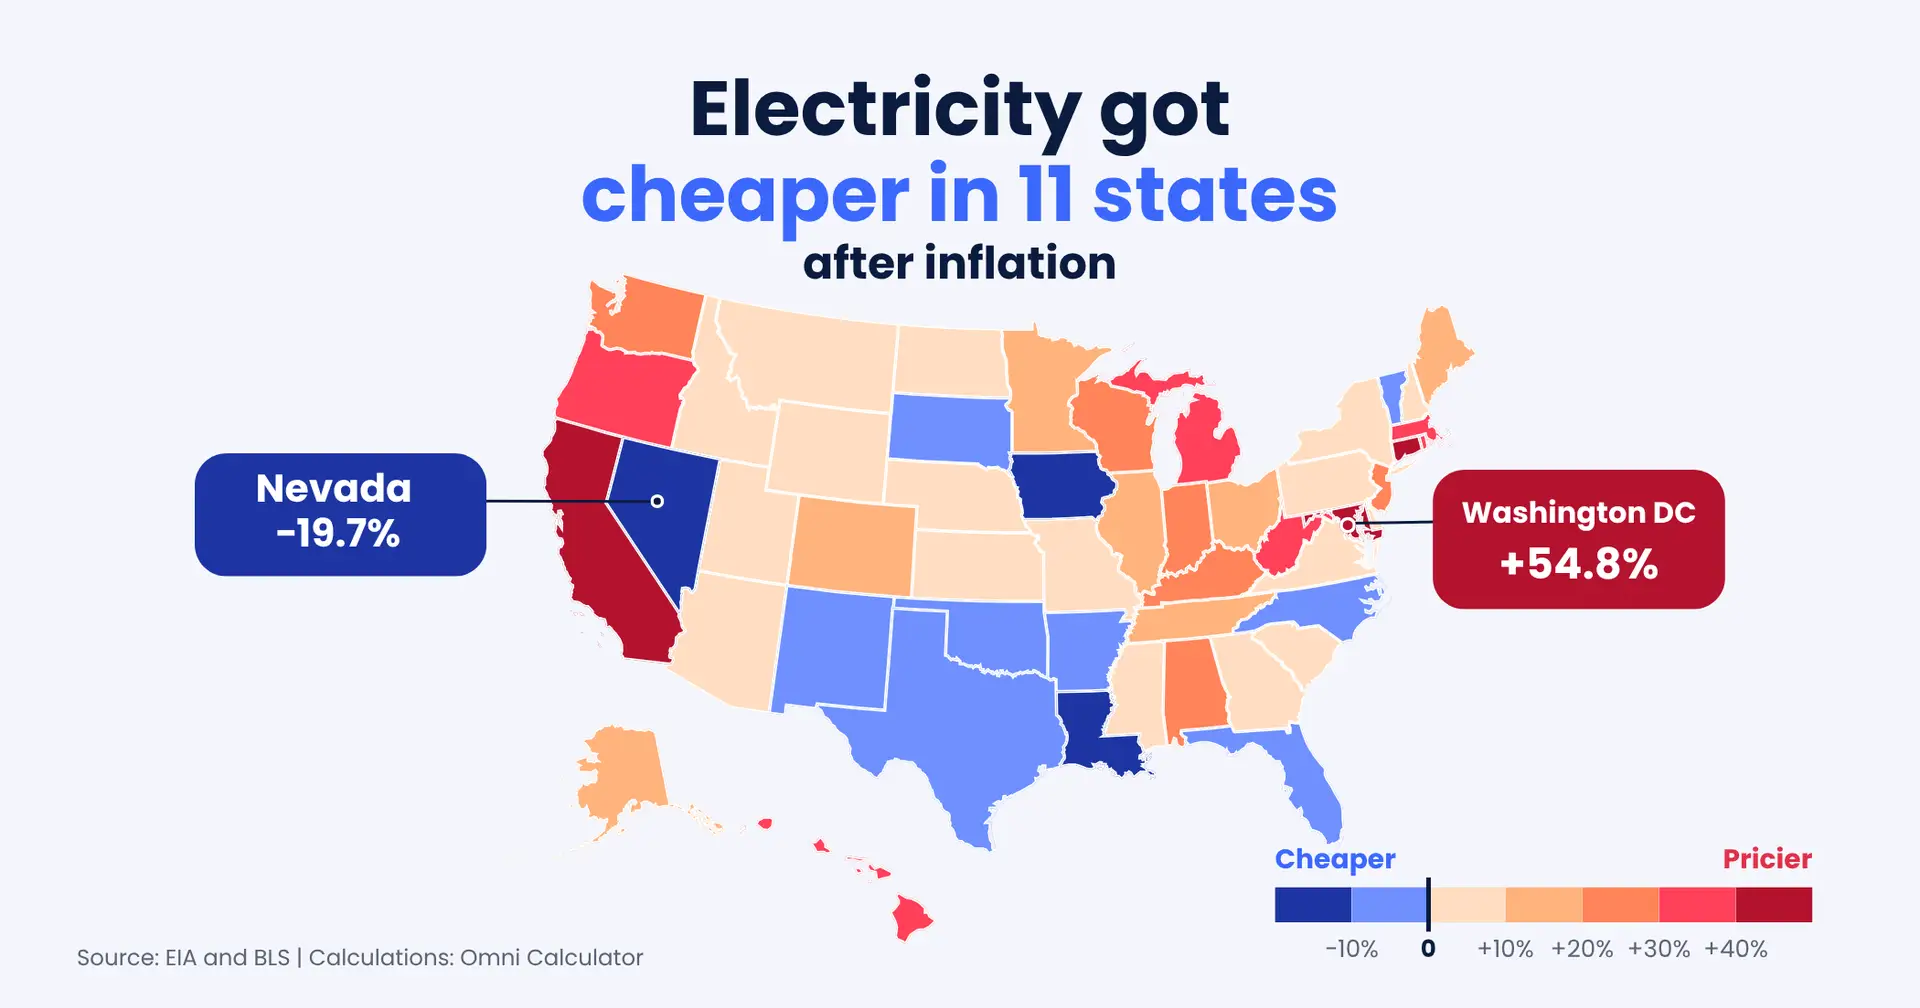
- Electricity became cheaper in 11 states after inflation, with Nevada seeing the biggest drop of nearly 20%.
- Washington, DC saw the steepest increase, with electricity prices rising nearly 55% faster than inflation, followed by Connecticut and California.
We analyzed data from the U.S. Energy Information Administration (EIA) and the Bureau of Labor Statistics, revealing just how differently electricity prices have changed across the country over the past 24 years.

The states with the largest electricity price increases and decreases after inflation, 2001–2025.
Where has electricity actually gotten cheaper?
Every state saw electricity prices rise between 2001 and 2025. But prices for almost everything else rose too.
After accounting for that broader inflation, electricity became cheaper in 11 states.
| State | 2001 Price (Adjusted for Inflation) | 2025 Price | Change After Inflation (%) |
| Nevada | 16.51¢ | 13.26¢ | −19.7% |
| Louisiana | 14.40¢ | 12.52¢ | −13.0% |
| Iowa | 15.29¢ | 13.62¢ | −10.9% |
| Arkansas | 14.03¢ | 12.87¢ | −8.3% |
| New Mexico | 15.89¢ | 14.85¢ | −6.5% |
| North Carolina | 14.76¢ | 14.00¢ | −5.2% |
| Texas | 16.11¢ | 15.40¢ | −4.4% |
| Florida | 15.62¢ | 15.21¢ | −2.6% |
| South Dakota | 13.49¢ | 13.32¢ | −1.2% |
| Vermont | 23.03¢ | 22.79¢ | −1.1% |
| Oklahoma | 13.22¢ | 13.21¢ | −0.04% |
Nevada stands out. In 2001, residents paid an average of 9.08 cents per kilowatt-hour, the unit used to measure electricity consumption. With inflation, that would be equivalent to 16.51 cents in 2025.
But the actual 2025 price was just 13.26 cents, nearly 20% below what inflation alone would suggest.
Louisiana followed with a 13% decline, while Iowa saw prices fall by nearly 11% after inflation.
Other states where electricity became cheaper included Arkansas, New Mexico, North Carolina, Texas, Florida, South Dakota, Vermont, and Oklahoma. Oklahoma's decline was tiny, leaving its inflation-adjusted price essentially unchanged.
For households in these states, electricity has become relatively less expensive than it was a generation ago, even if the number on their bills has gone up.
Where electricity prices rose the most
At the other end of the spectrum, electricity prices raced ahead of inflation in some parts of the country.
| State | 2001 price (adjusted for inflation) | 2025 price | Change after inflation (%) |
|---|---|---|---|
| Washington, DC | 14.16¢ | 21.92¢ | +54.8% |
| Connecticut | 19.81¢ | 29.31¢ | +47.9% |
| California | 21.98¢ | 31.35¢ | +42.6% |
| Maryland | 13.94¢ | 19.53¢ | +40.1% |
| Hawaii | 29.70¢ | 40.40¢ | +36.0% |
| West Virginia | 11.38¢ | 15.39¢ | +35.2% |
| Oregon | 11.43¢ | 15.46¢ | +35.2% |
| Massachusetts | 22.67¢ | 30.41¢ | +34.1% |
| Rhode Island | 22.05¢ | 29.48¢ | +33.7% |
| Michigan | 15.02¢ | 20.03¢ | +33.4% |
| Kentucky | 10.14¢ | 13.13¢ | +29.4% |
| Washington | 10.36¢ | 13.17¢ | +27.1% |
| Indiana | 12.58¢ | 15.96¢ | +26.9% |
| Alabama | 12.74¢ | 16.09¢ | +26.3% |
| Wisconsin | 14.36¢ | 18.08¢ | +25.9% |
| New Jersey | 18.56¢ | 22.48¢ | +21.1% |
| Alaska | 22.03¢ | 26.11¢ | +18.5% |
| Maine | 23.87¢ | 27.69¢ | +16.0% |
| Colorado | 13.58¢ | 15.69¢ | +15.5% |
| Tennessee | 11.49¢ | 13.22¢ | +15.1% |
| Minnesota | 13.83¢ | 15.83¢ | +14.4% |
| Illinois | 15.83¢ | 17.67¢ | +11.6% |
| Ohio | 15.22¢ | 16.90¢ | +11.1% |
| Pennsylvania | 17.60¢ | 19.29¢ | +9.6% |
| Delaware | 15.65¢ | 17.15¢ | +9.6% |
| Wyoming | 12.31¢ | 13.37¢ | +8.6% |
| Idaho | 10.93¢ | 11.83¢ | +8.3% |
| South Carolina | 13.98¢ | 15.12¢ | +8.2% |
| New Hampshire | 22.71¢ | 24.53¢ | +8.0% |
| Virginia | 14.16¢ | 15.28¢ | +7.9% |
| Utah | 12.22¢ | 13.02¢ | +6.6% |
| Georgia | 14.03¢ | 14.74¢ | +5.0% |
| Mississippi | 13.40¢ | 14.03¢ | +4.7% |
| Missouri | 12.73¢ | 13.30¢ | +4.5% |
| Montana | 12.51¢ | 12.99¢ | +3.9% |
| Kansas | 13.92¢ | 14.44¢ | +3.7% |
| New York | 25.52¢ | 26.39¢ | +3.4% |
| Nebraska | 11.82¢ | 12.05¢ | +2.0% |
| Arizona | 15.09¢ | 15.26¢ | +1.1% |
| North Dakota | 11.76¢ | 11.82¢ | +0.5% |
Showing all 40 entries
Prices are in cents per kWh. The 2001 prices are adjusted to 2025 dollars. Change shows the increase beyond inflation. Sources: EIA and BLS; calculations by Omni Calculator.
Washington, DC saw the largest increase. Its residential electricity price rose from 7.79 cents per kilowatt-hour in 2001 to 21.92 cents in 2025. That's a 54.8% increase beyond inflation.
Connecticut came next, followed by California, Maryland, and Hawaii.
Hawaii remains the most expensive state for electricity, at 40.40 cents per kilowatt-hour. That's more than three times North Dakota's 11.82 cents, the lowest rate in the country.
But Hawaii hasn't seen the biggest increase over time. That distinction belongs to Washington, DC.
How much have electricity prices risen nationwide?
Across the US, the average residential electricity price rose from 8.58 cents per kilowatt-hour in 2001 to 17.23 cents in 2025.
That's an increase of about 101%.
But overall consumer prices rose by roughly 82% over the same period. If electricity had simply kept pace with inflation, it would have cost around 15.60 cents per kilowatt-hour in 2025.
Instead, Americans paid 17.23 cents, about 10% more than inflation alone would explain.
In other words, electricity became somewhat more expensive nationwide, but the differences between states are much bigger.
What does this mean for your electricity bill?
There's one important catch: The price of electricity isn't the same as your monthly bill.
How much electricity a household uses matters just as much. Homes in hot climates may need more air conditioning, while homes in colder areas may use electricity for heating.
Consider two homes, each using 10,500 kilowatt-hours of electricity a year.
At Hawaii's average price for 2025, that would cost around $4,242 a year. In North Dakota, the same amount of electricity would cost just $1,241, a difference of about $3,001.
Actual households in those states use different amounts of electricity, so this is an illustration rather than a comparison of typical bills.
And electricity prices haven't stopped changing. In August 2026, the average US residential electricity price reached 18.16 cents per kilowatt-hour, up 3.4% from a year earlier, according to the EIA.
The long-term picture, however, is clear: While electricity has become more expensive nationally, where you live has made an enormous difference in just how much prices have risen.
Methodology and sources
We compared the EIA's annual average residential electricity prices for 2001 and 2025 across all 50 states and Washington, DC.
Using annual US consumer inflation data from the Bureau of Labor Statistics, we converted each state's 2001 price into its equivalent in 2025 dollars. We then compared that figure with the state's actual 2025 price.
This shows how much electricity prices changed beyond general inflation, rather than simply how much they increased in cents.
Calculations use national inflation figures, not separate inflation rates for each state. For a similar comparison of purchasing power over time, try Omni Calculator's inflation calculator.


loading

Loading