The average Social Security check buys 41% more than in 1986
• Finance
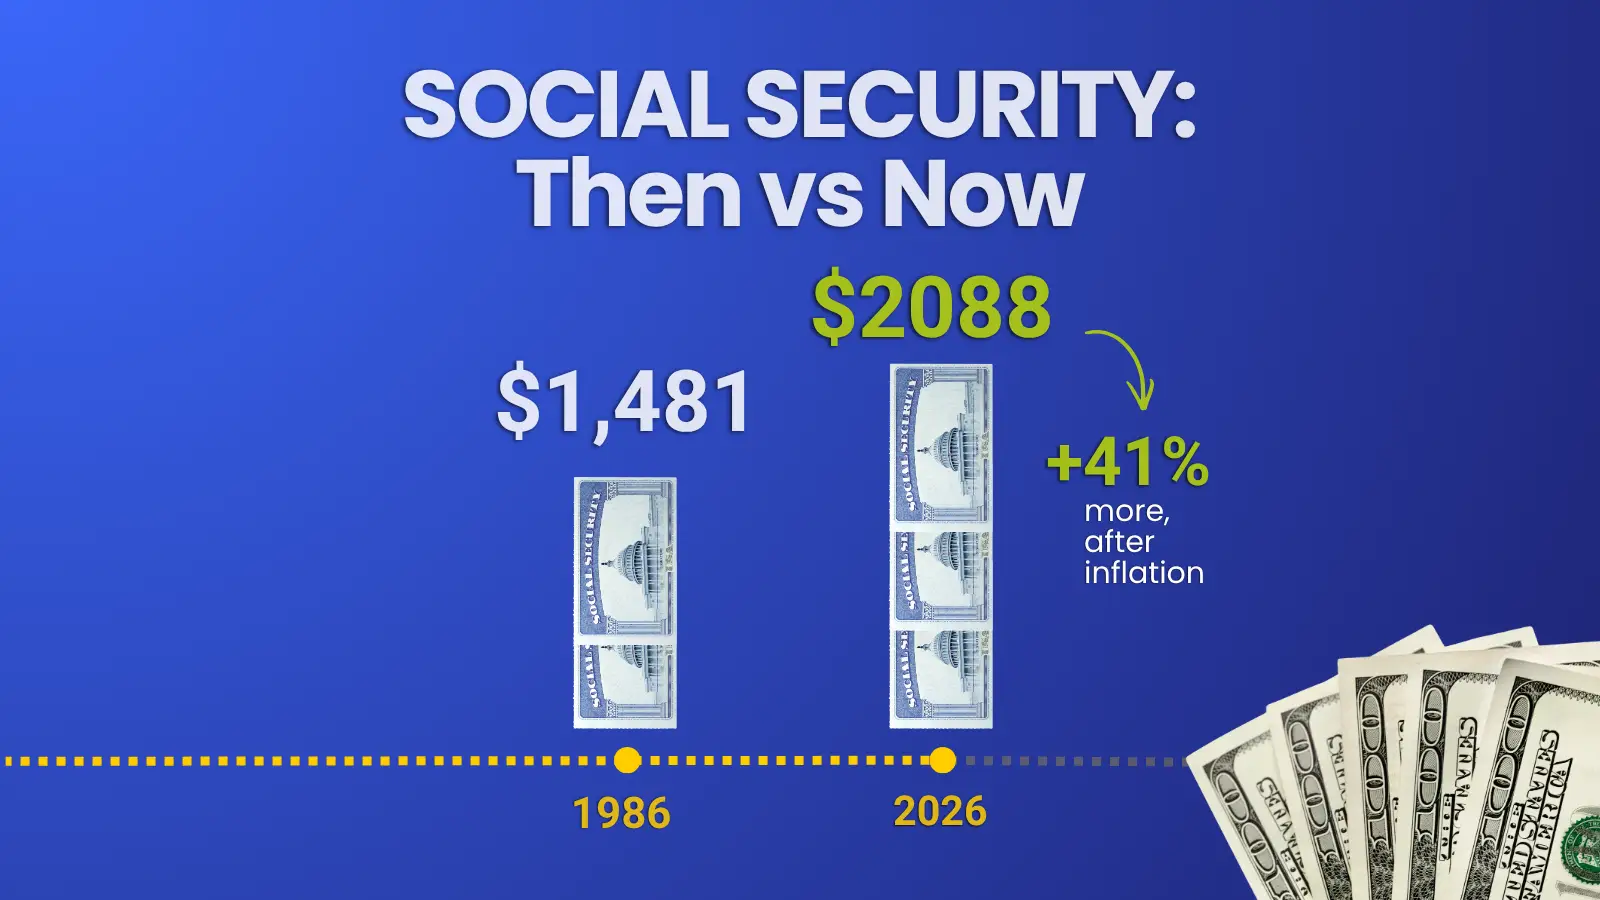
The average retired worker received $2,087.52 from Social Security in August 2026. In December 1986, the average was $488.44, worth about $1,481 today. So after inflation, today's check buys 41% more. Medicare takes a bigger bite though, and the program's trustees project a significant cut in 2032. That cut, applied to today's average check, would leave about what retirees got in 2000.
Key takeaways
- In August 2026 dollars, the average retired-worker benefit grew from $1,481 (1986) to $2,088 (2026), a 41% gain.
- Yearly cost-of-living adjustments have matched inflation (CPI-U) almost exactly since 1986. The increase comes from newer retirees having higher lifetime earnings.
- The standard Medicare Part B premium took 3.2% of the average check in 1986. In 2026 it takes 9.7%.
The average check decade by decade
In today's dollars, the average retired-worker check has grown in each decade since 1986, and the biggest increase came in the last ten years.

In the dollars of their own time, the averages were $488.44 (December 1986), $745.00 (1996), $1,044.40 (2006), $1,360.13 (2016) and $2,087.52 (August 2026).
Did yearly raises create the 41% gain?
For general inflation, almost exactly. A retiree who got the average $488.44 check in December 1986 and received every cost-of-living adjustment since would collect about $1,426 a month today. Keeping pace with the CPI-U on December 2025 would need $1,432, so the gap is under 0.5%.
That means the 41% rise in the average check doesn't come from raises for existing retirees. It comes from each new group of retirees starting with a bigger benefit, because their starting benefit is based on lifetime earnings indexed to national wage growth. Someone who retired in 1986 has roughly the same buying power today as then, minus a larger Medicare deduction.
The road ahead
The 2026 Trustees Report, released June 9, projects that the Old-Age and Survivors Insurance trust fund, which pays retirement benefits, will run out of reserves in the fourth quarter of 2032. After that, payroll taxes and other income would cover 78% of scheduled benefits, unless Congress changes the law. Combined with the disability fund, depletion comes in 2034, with 83% of benefits payable.
Methodology
Average benefits are for all retired workers in current-payment status, as of December each year. They come from SSA's Annual Statistical Supplement 2026, Table 5.B8, except for the 1986 figure ($488.44), which comes from the 2023 Supplement as reported by The Motley Fool. The 2026 figure is August 2026, from SSA's Monthly Statistical Snapshot.
We converted to August 2026 dollars using the CPI-U for all urban consumers, not seasonally adjusted (BLS via FRED), for December of each year and August 2026. Cost-of-living adjustments come from SSA's COLA history. If you want to calculate this for your specific case, check out our finance calculators designed for all kinds of specific tasks.


loading

Loading