Illinois Grew 533 Million Pounds of Pumpkins in 2025, About 42 Pounds Per Resident
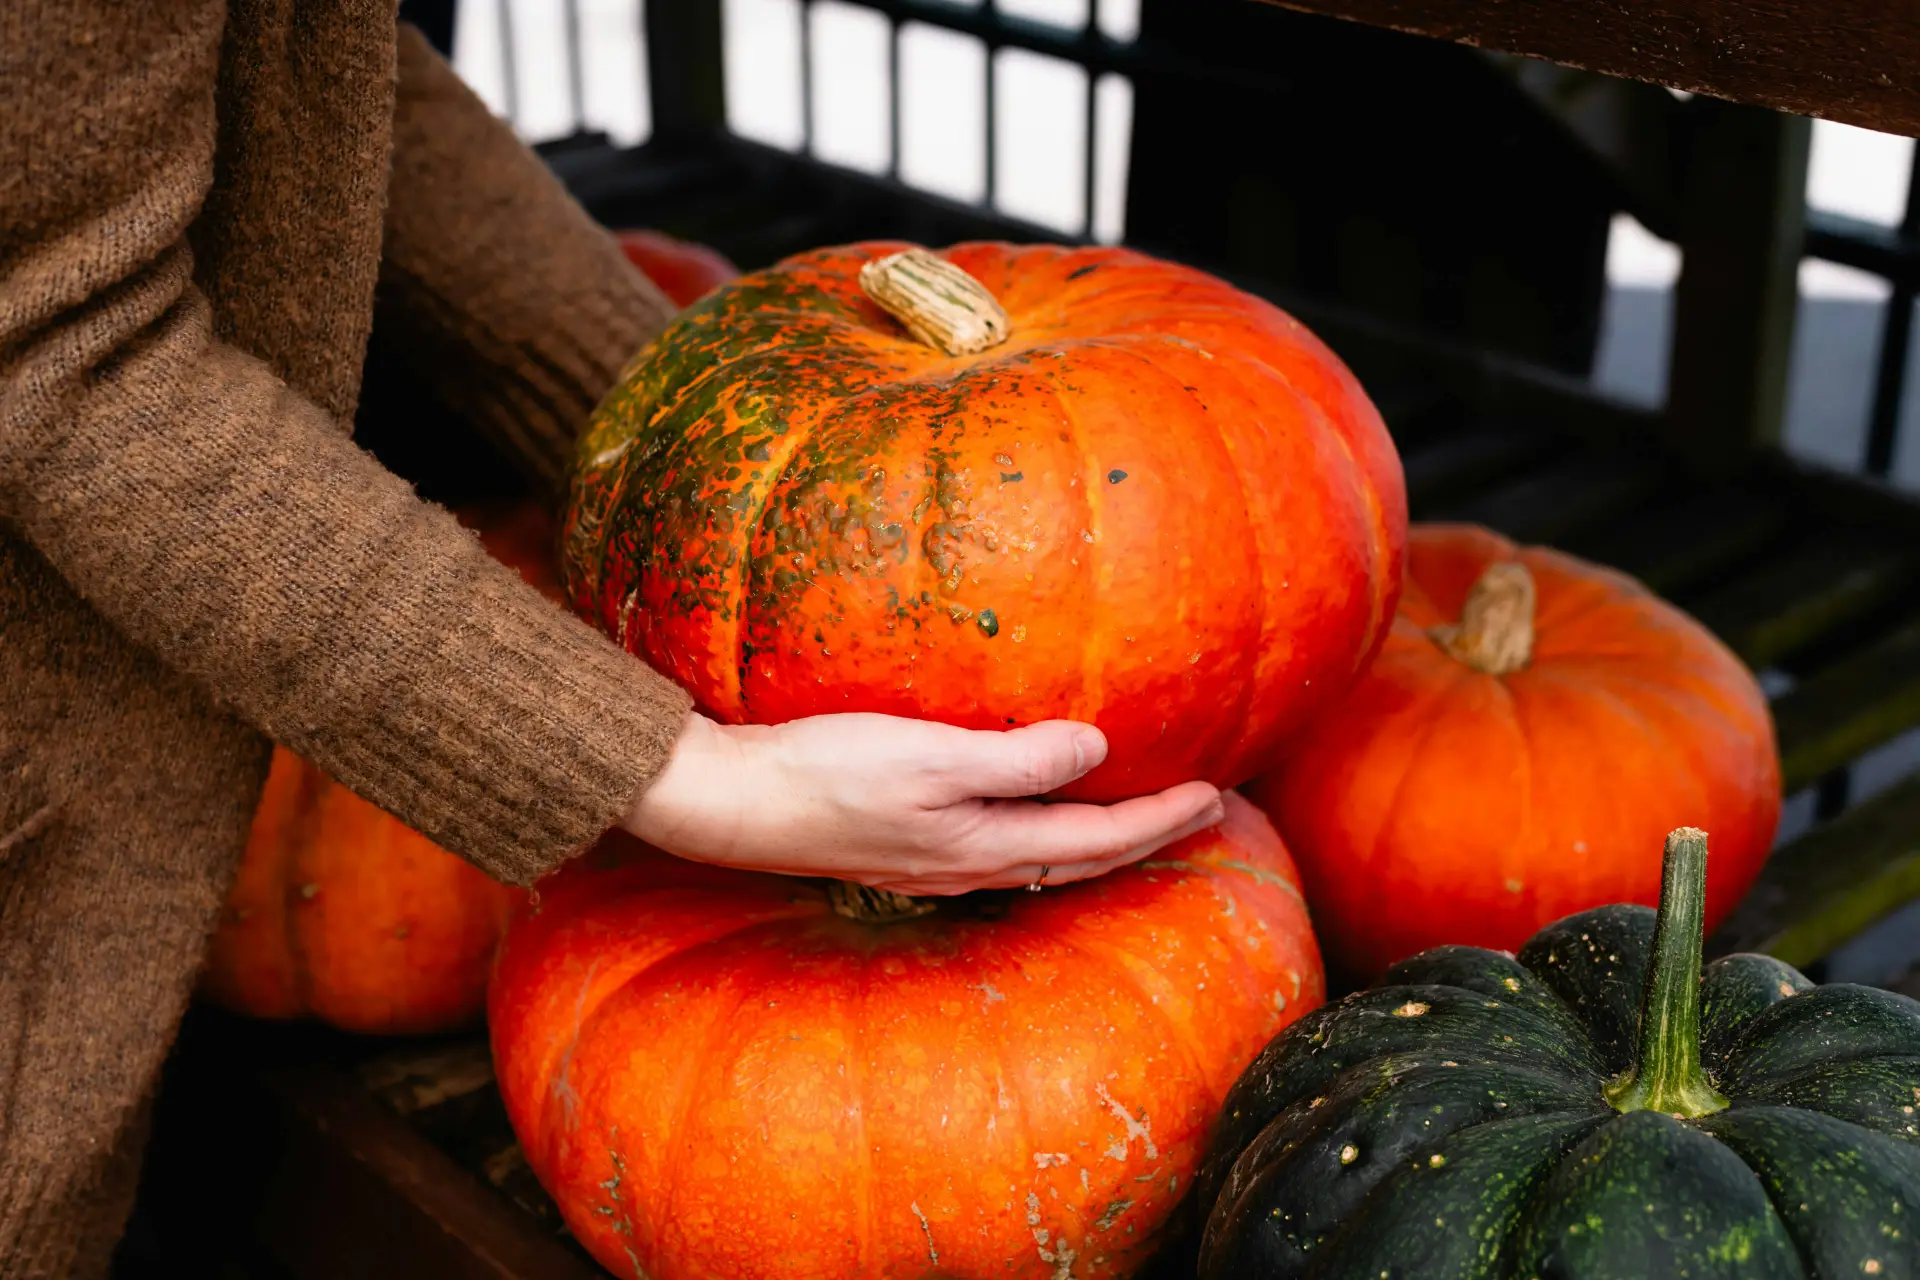
If you live in the United States and you have canned pumpkins in your pantry right now, there is up to a 95% chance that they came from Illinois.
Key Takeaways
- Illinois outproduced the next four top-producing states combined.
- Volume did not translate into value. Of the five states, Pennsylvania had the smallest crop, one-fifth of Illinois's. However, Pennsylvania earned one of the highest totals, second only to Indiana.
- The gap is in the purpose. What goes on the porch pays way more than what goes in the can.
| State | Millions of Pounds of Pumpkins (2025) |
| Illinois | 533 |
| California | 162 |
| Indiana | 135 |
| Michigan | 115 |
| Pennsylvania | 105 |
Together, the next four states produced 517 million pounds of pumpkins in 2025. This means that in 2025, Illinois produced approximately 51% of the pumpkins coming out of the five top-producing states.

The interesting part is what the people of Illinois do with these pumpkins. According to the most recently available USDA data, nearly 70% of Illinois pumpkin acreage is devoted to processing (2022). This is a stark contrast to the other states. Pennsylvania devotes about 3 percent of its pumpkin acreage to processing, while in California and Indiana, less than 1% is used this way.
Why Illinois? The Orange Belt and the Processing Industry
Morton, Illinois, a town of 17,565 people, is home to Libby’s, a canning company. Owned by Nestle, the company has produced canned pumpkins for approximately 100 years. According to the calculations obtained using the USDA acreage by state data for these five states, in 2022, approximately 93.4% of the total acreage dedicated to processed pumpkins came from Illinois. On a larger scale, in 2022, 86% of the acreage dedicated to pumpkins grown for processing nationwide came from Illinois.
Illinois pumpkin production is due to the fact that it sits in what is known as the orange belt. The orange belt is an area characterized by dark, rich, prairie soil ideal for growing pumpkins. Illinois produces Dickinson pumpkin, which is best for processing.
Illinois Grows 42 Pounds of Pumpkin Per Person
When we take into account the population per state and the ratio of millions of pounds of pumpkin to residents, the amount produced by Illinois alone is even more shocking.
| State | Production (million lb) | Population (Million) | Pounds per resident |
| Illinois | 533 | 12.7 | 41.9 |
| California | 162 | 39.3 | 4.1 |
| Indiana | 135 | 6.9 | 19.4 |
| Michigan | 115 | 10.1 | 11.4 |
| Pennsylvania | 105 | 13.1 | 8.0 |

Production: USDA ERS, Population: US Census Bureau Vintage 2025 Estimates
According to this data, Illinois grows about 10 times as many pumpkins per resident as California. It also grows more than twice as many pumpkins per person as Indiana, the state with the second-highest pounds per resident.
What is 533 Million Pounds Equal to in Pumpkins?
So what does Illinois’ harvest of 533 million pounds represent in actual pumpkins? At an estimated 10 to 14 pounds per Dickinson pumpkin, the 2025 harvest represents 38.1 to 53.3 million pumpkins.
What Happens to the Pumpkins in the Other States?
California, Indiana, Michigan, and Pennsylvania grow and sell their pumpkins almost entirely for the fresh and ornamental market. 85% of the US pumpkin acreage also goes to fresh and ornamental use.
This means that the canned pumpkin you have in your kitchen almost certainly came from Illinois.

Has Illinois Always Led in Pumpkin Production?
For as far back as 1992, for most years Illinois has had the largest acreage of land devoted to pumpkin production, compared to the other states. The fact that the Libby’s processing plant is located there has made this a sustainable large-scale industry. On the other hand, the fresh and ornamental producing states are dominated by small farms that sell directly to customers on a smaller scale.
The Value Paradox: The Price of Being the Processing State
If Illinois is the king of pumpkin production, Pennsylvania is the undisputed price king. The USDA data show that in 2025, Illinois earned less per thousand pounds for its pumpkins than any of the other four states.
Pennsylvania, on the other hand, earned the most per thousand pounds. Indiana earned the most from the total crop. Illinois earned among the least for its total production.
This disparity is due to the fact that the fresh and ornamental markets pay better, and nearly 70% of Illinois acreage is dedicated to pumpkins for processing.
| State | Production (million lb) | 2025 price per 1,000 lb | Revenue |
| Michigan | 115 | $198 | $22,770,000 |
| Illinois | 533 | $48 | $25,584,000 |
| California | 162 | $160 | $25,920,000 |
| Pennsylvania | 105 | $269 | $28,245,000 |
| Indiana | 135 | $237 | $31,995,000 |
Methodology
The pounds per resident and population data in this report have been rounded to 1 decimal place. The USDA does not publish a pumpkin count, so the weight of 10 to 14 for a Dickinson pumpkin is an estimate.

loading
Loading