Eggs Up 86% Since 2019, Bananas Barely Moved: Here Is What $100 Buys Now
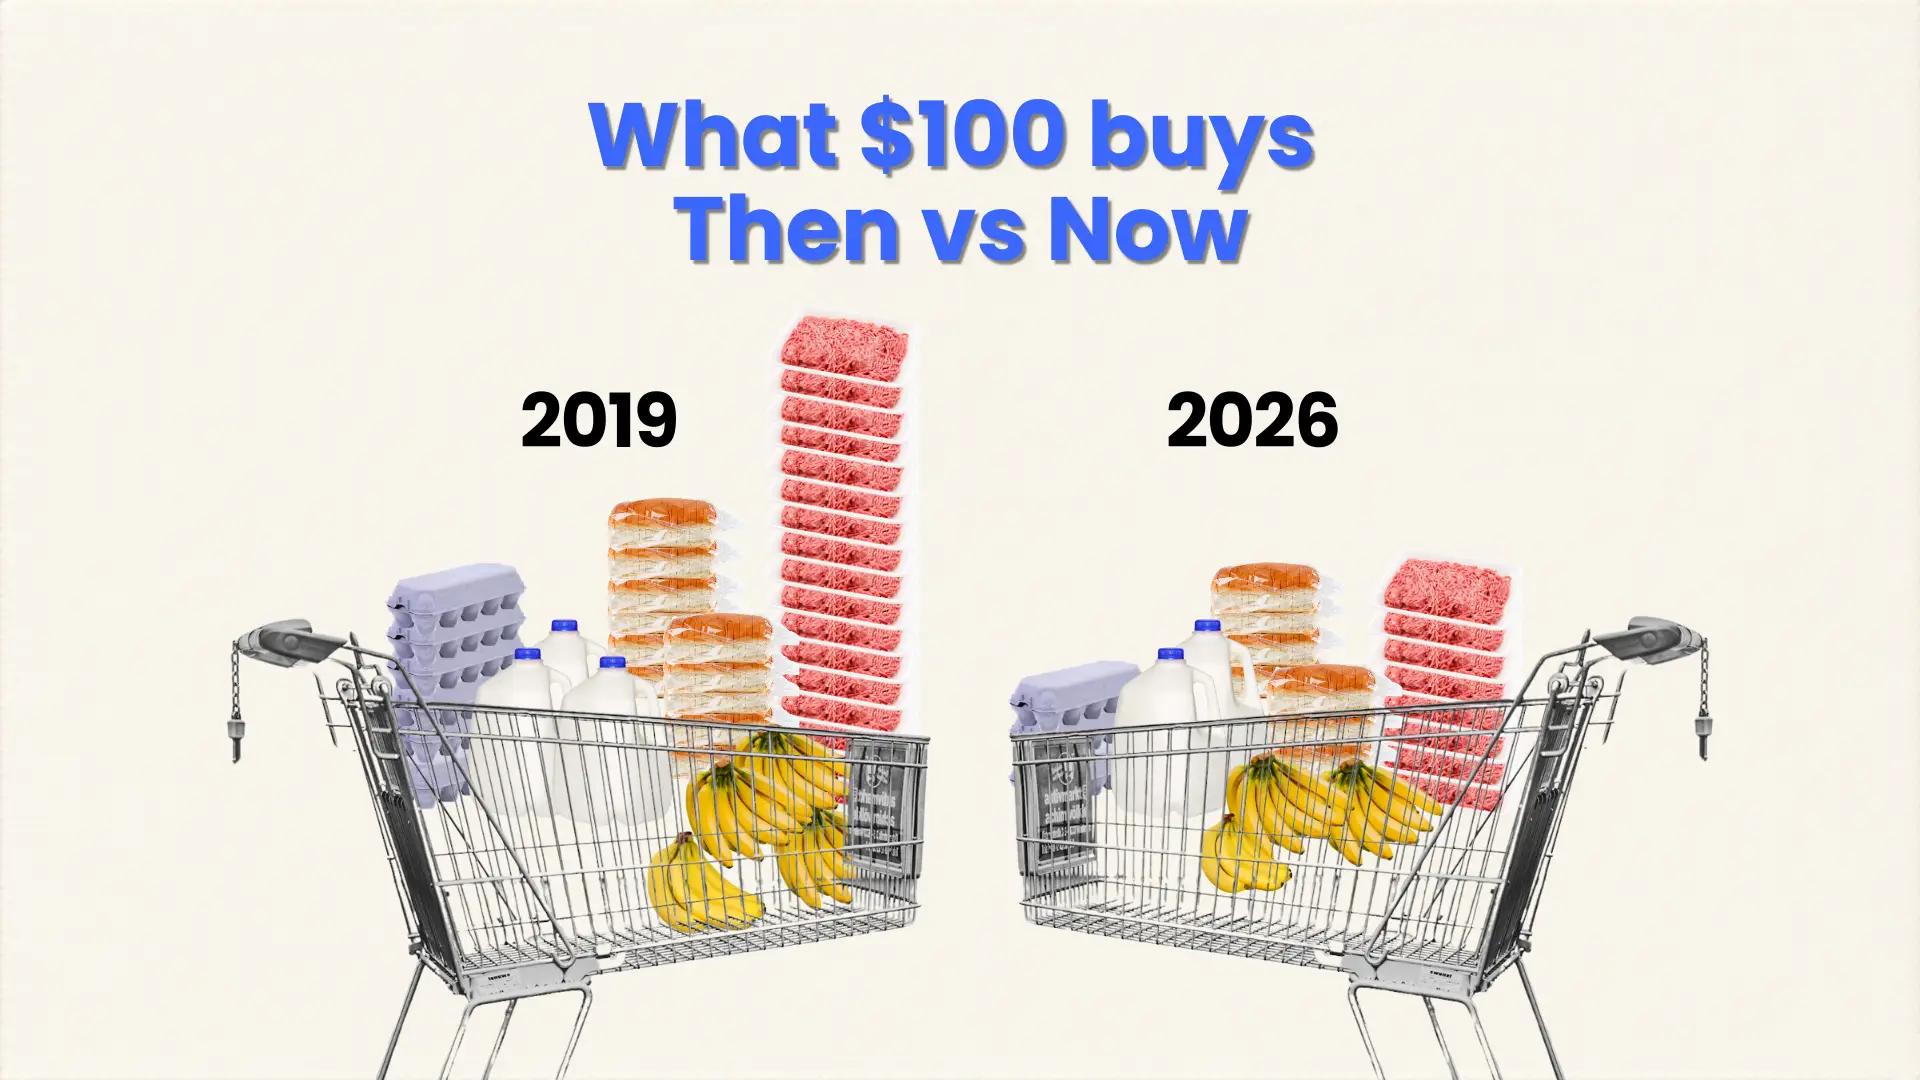
In August 2019, a $100 basket of groceries packed with five household staples held approximately 6.6 dozen large grade A eggs, 3.3 gallons of fresh whole milk, 11.7 lbs of white bread, 17 lbs of ground beef, and 3.5 lbs of bananas.
Today, the same $100 buys what $62.60 did in 2019. The biggest mover is eggs, which cost 86% more in 2026 than they did in 2019. The smallest mover is bananas, with a meager 12% price increase.
The prices are US city averages taken from a report by the Bureau of Labor Statistics. These prices are not adjusted for inflation.
Key Takeaways
- The contents of the cart shrank. $100 in 2026 buys what $62.60 did in 2019.
- Eggs are up 86%, while the price of bananas is the least affected.
- Wages tell the real story. Real wages increased by 3%.
Note
The prices used in this article are rounded to two decimal places, and percentages are rounded to whole numbers.
The following table compares the price per unit of each item in August 2019 and 2026.
| Item | Unit | August 2019 | August 2026 | Change in $ | Change in % |
| Large, grade A eggs | 1 dozen | $1.22 | $2.27 | +$1.05 | 86% |
| Fresh, whole, fortified milk | 1 gallon | $3.05 | $4.23 | +$1.18 | 39% |
| White bread | 1 lb | $1.28 | $1.82 | +$0.54 | 42% |
| Ground beef | 1 lb | $3.82 | $6.92 | +$3.10 | 81% |
| Bananas | 1 lb | $0.58 | $0.65 | +$0.07 | 12% |
| Total | $9.95 | $15.89 | +$5.94 | 60% |
Source: BLS Average Price Data, August 2019 and August 2026 (not seasonally adjusted)

So what does this data mean? $100 in 2026 buys what $62.60 did in 2019. This is significant.
The Two Carts, Side by Side
To show what a $100 budget buys, we split it across our five staples: $65 for beef, $10 for milk, $2 for bananas, $8 for eggs, and $15 for bread. This reflects total household spending.
The largest share goes to beef because beef costs more per lb than every other item in the basket.
Below is an example of two baskets of groceries worth $100, with one being purchased in August 2019 and the other in August 2026.

If we keep each item’s share of the $100 budget, the quantities shrink for every item. The effect was not spread equally across the cart, either. The price of milk and bread rose modestly, while beef and eggs are where shoppers are feeling the pressure the most.
| Items | Basket in 2019 | Basket in 2026 | Cost |
| Large, grade A eggs | 6.6 dozen | 3.5 dozen | $8 |
| Fresh, whole, fortified milk | 3.3 gallons | 2.4 gallons | $10 |
| White bread | 11.7 lbs | 8.2 lbs | $15 |
| Ground beef | 17 lbs | 9.4 lbs | $65 |
| Bananas | 3.5 lbs | 3.1 lbs | $2 |
| Total Cost | $100 |
The units used in the above table are rounded to one decimal place.
The graph below helps us to visualize how much the prices of these five household staples have changed between August 2019 and August 2026.
How Have Wages Held Up Against These Price Increases?
| Measure | August 2019 | August 2026 | Change |
| CPI-U | 256.558 | 334.980 | +30.6% |
| Average Hourly Earnings | $28.11 | $37.75 | +34.3% |
| Real Average Hourly Earnings (1982-84$ ) | $9.95 | $11.30 | +3.0% |
The average hourly earnings for private-sector workers on nonfarm payrolls have moved from $28.11 in August 2019 to $37.75 in August 2026, a 34% increase. This means that the cost of four of these five staples has increased faster than wages.
The main driving forces of this change have been eggs at 86% and ground beef at 81%.
Taking one unit of each item, the total cost of our 5 staples rose from $10.15 to $15.89 in 2026, an increase of 60%, well ahead of wages, which increased by 34%.
The Hidden Numbers in the Story
When adjusted for inflation, there is another story here. Real wages grew by 3%. In real terms, bananas are 14% cheaper. Milk and bread rose modestly at 6% and 9%, respectively. Ground beef rose by 39%, while eggs rose about 43%.
How the Basket Compares to Overall Grocery Inflation
While the price of the five-item basket rose by 60% in nominal terms, the BLS food-at-home index rose about 33% over the same period. This gap was driven by beef and eggs, which rose much faster than the other items in the basket.
When adjusted for inflation, the cost of the items in the basket rose 23%, which is 20 percentage points higher than the 3% increase in wages.
Considering that the items driving up the price are beef and eggs, this means that shoppers who often buy these items will spend more than those who buy mostly bread, milk, and bananas. With today being World Food Day, this comparison is a stark reminder that what $100 is able to buy depends on the items in the cart.
Sources
- U.S. Bureau of Labor Statistics. (2025). Average price data (in U.S. dollars), selected items. Www.Bls.Gov. https://www.bls.gov/charts/consumer-price-index/consumer-price-index-average-price-data.htm
- Davis, C. (2026). Factors affecting U.S. beef consumption | Economic Research Service. Usda.Gov. https://www.ers.usda.gov/publications/37389
- Grossen, G. (2026). Animal protein continues to be plentiful for U.S. consumers | Economic Research Service. Usda.Gov. http://ers.usda.gov/data-products/charts-of-note/114196
- Table B-3. average hourly and weekly earnings of all employees on private nonfarm payrolls by industry sector, seasonally adjusted. (2026, October 2). Www.Bls.Gov. https://www.bls.gov/news.release/empsit.t19.htm
- Real earnings news release. (2019). Bureau of Labor Statistics. https://www.bls.gov/news.release/archives/realer_09122019.htm
- Table A-1. current and real (constant 1982-1984 dollars) earnings for all employees on private nonfarm payrolls, seasonally adjusted. (2018). Bls.Gov. https://www.bls.gov/news.release/realer.t01.htm
- TRADING ECONOMICS. (2026). United States - consumer price index for all urban consumers: Food at home in U.S. city average. Tradingeconomics.Com. https://tradingeconomics.com/united-states/consumer-price-index-for-all-urban-consumers-food-at-home-fed-data.html

loading

Loading