A Dutch worker's pension replaces $96 of every $100 earned. In the US, Social Security replaces $51
• Finance
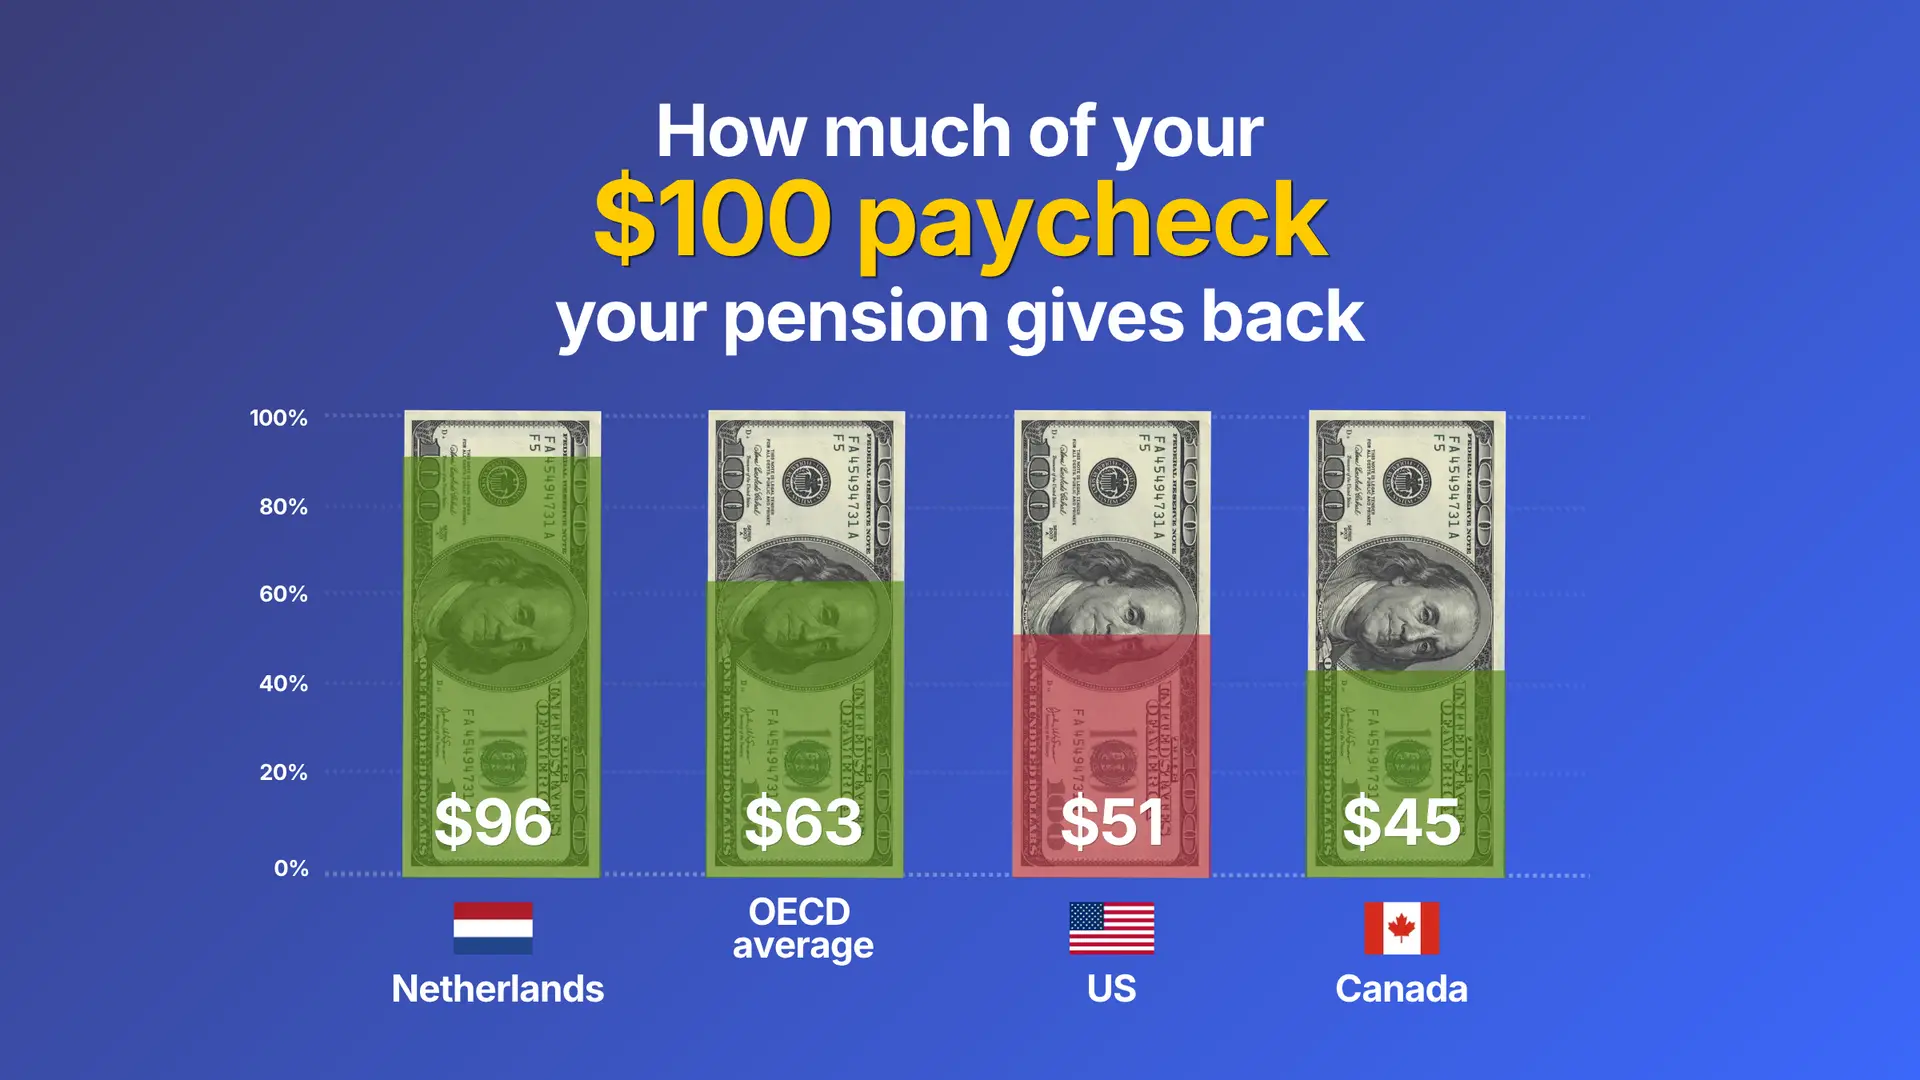
Out of every $100 an average American worker takes home, Social Security is set to replace $51 in retirement, while a Dutch worker's pension will replace $96.
Key takeaways
- The US isn't at the bottom of the list, and a few countries that might surprise you sit below it.
- Add a lifetime of 401(k) saving and the picture flips completely.
- If you earn less than average, Social Security works out better for you than the headline number suggests.
How the US stacks up
The numbers come from the OECD's Pensions at a Glance 2025, which compares pension systems across 38 rich countries. The measure is the net replacement rate from mandatory pension schemes for an average earner: the pension in the first year of retirement as a share of what the person took home while working, after income taxes and social contributions. Multiply it by 100 and you get dollars out of every $100.
That main figure leaves out 401(k)s and IRAs, because they're voluntary. When the OECD adds a full career of that kind of saving, the US figure jumps to about $101, slightly more than the paycheck it replaces. More on that below.
One more detail matters for the comparison. In the US, the mandatory scheme is Social Security. In many other countries, mandatory pensions also include workplace plans that are required by law or by industry-wide agreements, which is a big part of why some numbers run so high.
With that in mind, the US lands at $51, below the OECD average of $63. Of the 38 countries, 28 come in higher. Here's where some familiar names land:
- Netherlands: $96, the highest in the OECD
- Portugal: $93
- France: $70
- OECD average: $63
- United Kingdom: $54
- Germany and Australia: $53
- United States: $51
- Canada: $45
- Japan: $42
- Lithuania: $28, the lowest
The surprise for many readers is the bottom half of the list. Canada, Japan and Switzerland all sit below the US, and so do Ireland and Poland. The US is under the average, but it's far from last.
Why the US number is lower
Social Security was never meant to cover a whole retirement on its own. It was built as a base, a floor that workplace plans and personal savings are supposed to sit on top of. The US leaves that top layer up to workers and employers.
Many of the countries at the top of the list take the opposite route and make the extra layers part of the system. In the Netherlands, workplace pension funds are agreed for whole industries, so the OECD counts them as mandatory. That's how the Dutch figure climbs to $96. In the US, the closest equivalent is a 401(k), and because nobody is required to have one, it doesn't make the main number.
It's also worth being clear about who these numbers describe. They aren't today's retirement checks. The OECD models a hypothetical worker who earns the average wage, works a full career and retires under the pension rules in place now. The result is a projection of what today's workers can expect, not a measure of what current retirees are getting.
What the $51 leaves out
The $51 is a useful starting point, but three things can move your own number a long way from it.
Your 401(k) or IRA. The OECD runs a second version of its numbers that adds a voluntary workplace plan, paid into every year of a full career. For the US, that pushes the figure from $51 to about $101. In other words, a worker who saves steadily from their first job to their last could take home about as much in retirement as they did at work. The catch is in the assumptions. Not every worker has access to a plan, and the figure counts on contributions every single year.
How much you earn. Social Security's benefit formula is tilted toward lower earners. A worker earning half the average wage is set to get back about $62 of every $100, while someone earning double the average gets about $40. Benefits still grow with pay, just more slowly than pay does, so the bigger the paycheck, the smaller the share Social Security replaces.
Taxes. The figures are net, which means they compare take-home pay with take-home pension, after income taxes and social contributions on both sides. That's a fairer comparison than gross pay, because most people stop paying payroll tax once they retire and often pay less income tax too.
To see where your own benefit might land, you can try Omni's Social Security calculator.
What about the trust fund?
The OECD models benefits under current law. The 2026 Trustees Report projects that, without legislative action, the OASI Trust Fund could pay 78% of scheduled benefits after reserves are depleted in the fourth quarter of 2032.
More in this series: how Social Security checks have changed then and now, and how far they stretch state by state.
Methodology
All country figures come from the OECD's Pensions at a Glance 2025, published in November 2025. They show the net replacement rate from mandatory pension schemes for a man earning the average wage over a full career, plus the US figures at half and double the average wage and with voluntary schemes included. Dollar amounts are the published rates multiplied by 100 and rounded to the nearest dollar.
Most Read


loading