Welcome to our t-test calculator! Here you can not only easily perform one-sample t-tests, but also two-sample t-tests, as well as paired t-tests.
Do you prefer to find the p-value from the t-test, or would you rather find the t-test critical values? Well, this t-test calculator can do both! 😊
What does a t-test tell you? Take a look at the text below, where we explain what actually gets tested when various types of t-tests are performed. Also, we explain when to use t-tests (in particular, whether to use the z-test vs. t-test) and what assumptions your data should satisfy for the results of a t-test to be valid. If you've ever wanted to know how to do a t-test by hand, we provide the necessary t-test formula, as well as tell you how to determine the number of degrees of freedom in a t-test.
You can also learn more about the different statistical parameters in our article: p-value vs. t-value.
What is a t-test?
A t-test is one of the most popular statistical tests for location, dealing with the population(s) mean value(s). It is a statistical technique for measuring the difference between the mean values of one and two sample datasets by considering hypothesis testing. It is also known as the Student's t-test and is applied when data has a normal distribution, and the population variance is unknown.
The t-test uses t-statistics, t-distribution values, and degrees of freedom to obtain the critical value for a given significance level. Our t-statistic calculator covers this topic in more detail.
Moreover, the t-distribution curve can be approximated by a normal curve as the sample size grows, which is further categorized as one-tailed (right tail and left tail) and two-tailed.
There are different types of t-tests that you can perform:
- A one-sample t-test;
- A two-sample t-test; and
- A paired t-test.
In the next section, we explain when to use which.
Remember that a t-test can only be used for one or two groups. If you need to compare three (or more) means, use the ANOVA Calculator.
The t-test is a parametric test, meaning that your data has to fulfill some assumptions:
- The data points are independent; AND
- The data, at least approximately, follow a normal distribution.
If your sample doesn't fit these assumptions, you can resort to nonparametric alternatives, such as the Mann–Whitney U test or the Wilcoxon rank-sum test. Other possibilities include the Wilcoxon signed-rank test or the sign test.
Types of t-tests
Your choice of t-test depends on whether you are studying one group or two groups:
-
One sample t-test
Choose the one-sample t-test to check if the mean of a population is equal to some pre-set hypothesized value.
Examples:
-
The average volume of a drink sold in 0.33 l cans — is it really equal to 330 ml?
-
The average weight of people from a specific city — is it different from the national average?
-
-
Two-sample t-test
Choose the two-sample t-test to check if the difference between the means of two populations is equal to some pre-determined value when the two samples have been chosen independently of each other.
In particular, you can use this test to check whether the two groups are different from one another.
Examples:
-
The average difference in weight gain in two groups of people: one group was on a high-carb diet and the other on a high-fat diet.
-
The average difference in the results of a math test from students at two different universities.
This test is sometimes referred to as an independent samples t-test, or an unpaired samples t-test.
-
-
Paired t-test
A paired t-test is used to investigate the change in the mean of a population before and after some experimental intervention, based on a paired sample, i.e., when each subject has been measured twice: before and after treatment.
In particular, you can use this test to check whether, on average, the treatment has had any effect on the population.
Examples:
-
The change in student test performance before and after taking a course.
-
The change in blood pressure in patients before and after administering some drug.
-
How to do a t-test
So, you've decided which t-test to perform. These next steps will tell you how to calculate the p-value from t-test or its critical values, and then which decision to make about the null hypothesis.
-
Decide on the alternative hypothesis:
-
Use a two-tailed t-test if you only care whether the population's mean (or, in the case of two populations, the difference between the populations' means) agrees or disagrees with the pre-set value.
-
Use a one-tailed t-test if you want to test whether this mean (or difference in means) is greater/less than the pre-set value.
-
-
Compute your T-score value:
Formulas for the test statistic in t-tests include the sample size, as well as its mean and standard deviation. The exact formula depends on the t-test type — check the sections dedicated to each particular test for more details.
-
Determine the degrees of freedom for the t-test:
The degrees of freedom are the number of observations in a sample that are free to vary as we estimate statistical parameters. In the simplest case, the number of degrees of freedom equals your sample size minus the number of parameters you need to estimate. Again, the exact formula depends on the t-test you want to perform — check the sections below for details.
The degrees of freedom are essential, as they determine the distribution followed by your T-score (under the null hypothesis). If there are d degrees of freedom, then the distribution of the test statistics is the t-Student distribution with d degrees of freedom. This distribution has a shape similar to N(0,1) (bell-shaped and symmetric) but has heavier tails. If the number of degrees of freedom is large (>30), which generically happens for large samples, the t-Student distribution is practically indistinguishable from N(0,1).

💡 The t-Student distribution owes its name to William Sealy Gosset, who, in 1908, published his paper on the t-test under the pseudonym "Student". Gosset worked at the famous Guinness Brewery in Dublin, Ireland, and devised the t-test as an economical way to monitor the quality of beer. Cheers! 🍺🍺🍺
p-value from t-test
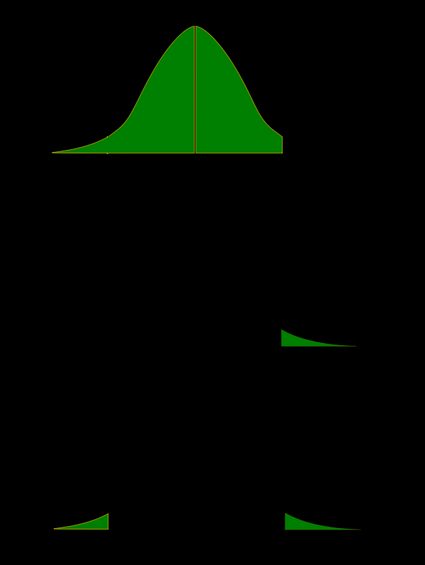
Recall that the p-value is the probability (calculated under the assumption that the null hypothesis is true) that the test statistic will produce values at least as extreme as the T-score produced for your sample. As probabilities correspond to areas under the density function, p-value from t-test can be nicely illustrated with the help of the following pictures:
The following formulae say how to calculate p-value from t-test. By cdft,d we denote the cumulative distribution function of the t-Student distribution with d degrees of freedom:
-
p-value from left-tailed t-test:
p-value = cdft,d(tscore)
-
p-value from right-tailed t-test:
p-value = 1 − cdft,d(tscore)
-
p-value from two-tailed t-test:
p-value = 2 × cdft,d(−|tscore|)
or, equivalently: p-value = 2 − 2 × cdft,d(|tscore|)
However, the cdf of the t-distribution is given by a somewhat complicated formula. To find the p-value by hand, you would need to resort to statistical tables, where approximate cdf values are collected, or to specialized statistical software. Fortunately, our t-test calculator determines the p-value from t-test for you in the blink of an eye!
t-test critical values
Recall, that in the critical values approach to hypothesis testing, you need to set a significance level, α, before computing the critical values, which in turn give rise to critical regions (a.k.a. rejection regions).
Formulas for critical values employ the quantile function of t-distribution, i.e., the inverse of the cdf:
-
Critical value for left-tailed t-test:
cdft,d-1(α)critical region:
(-∞, cdft,d-1(α)]
-
Critical value for right-tailed t-test:
cdft,d-1(1-α)critical region:
[cdft,d-1(1-α), ∞)
-
Critical values for two-tailed t-test:
±cdft,d-1(1-α/2)critical region:
(-∞, -cdft,d-1(1-α/2)] ∪ [cdft,d-1(1-α/2), ∞)
To decide the fate of the null hypothesis, just check if your T-score lies within the critical region:
-
If your T-score belongs to the critical region, reject the null hypothesis and accept the alternative hypothesis.
-
If your T-score is outside the critical region, then you don't have enough evidence to reject the null hypothesis.
How to use our t-test calculator
-
Choose the type of t-test you wish to perform:
-
A one-sample t-test (to test the mean of a single group against a hypothesized mean);
-
A two-sample t-test (to compare the means for two groups); or
-
A paired t-test (to check how the mean from the same group changes after some intervention).
-
-
Decide on the alternative hypothesis:
-
Two-tailed;
-
Left-tailed; or
-
Right-tailed.
-
-
This t-test calculator allows you to use either the p-value approach or the critical regions approach to hypothesis testing!
-
Enter your T-score and the number of degrees of freedom. If you don't know them, provide some data about your sample(s): sample size, mean, and standard deviation, and our t-test calculator will compute the T-score and degrees of freedom for you.
-
Once all the parameters are present, the p-value, or critical region, will immediately appear underneath the t-test calculator, along with an interpretation!
One-sample t-test formula
-
The null hypothesis is that the population mean is equal to some value .
-
The alternative hypothesis is that the population mean is:
- different from ;
- smaller than ; or
- greater than .
One-sample t-test formula:
where:
- — Mean postulated in the null hypothesis;
- — Sample size;
- — Sample mean; and
- — Sample standard deviation.
Number of degrees of freedom in t-test (one-sample) = .
Two-sample t-test formula
-
The null hypothesis is that the actual difference between these groups' means, , and , is equal to some pre-set value, .
-
The alternative hypothesis is that the difference is:
- Different from ;
- Smaller than ; or
- Greater than .
In particular, if this pre-determined difference is zero ():
-
The null hypothesis is that the population means are equal.
-
The alternate hypothesis is that the population means are:
- and are different from one another;
- is smaller than ; and
- is greater than .
Formally, to perform a t-test, we should additionally assume that the variances of the two populations are equal (this assumption is called the homogeneity of variance).
There is a version of a t-test that can be applied without the assumption of homogeneity of variance: it is called a Welch's t-test. For your convenience, we describe both versions.
Two-sample t-test if variances are equal
Use this test if you know that the two populations' variances are the same (or very similar).
Two-sample t-test formula (with equal variances):
where is the so-called pooled standard deviation, which we compute as:
where:
- — Mean difference postulated in the null hypothesis;
- — First sample size;
- — Mean for the first sample;
- — Standard deviation in the first sample;
- — Second sample size;
- — Mean for the second sample; and
- — Standard deviation in the second sample.
Number of degrees of freedom in t-test (two samples, equal variances) = .
Two-sample t-test if variances are unequal (Welch's t-test)
Use this test if the variances of your populations are different.
Two-sample Welch's t-test formula if variances are unequal:
where:
- — Mean difference postulated in the null hypothesis;
- — First sample size;
- — Mean for the first sample;
- — Standard deviation in the first sample;
- — Second sample size;
- — Mean for the second sample; and
- — Standard deviation in the second sample.
The number of degrees of freedom in a Welch's t-test (two-sample t-test with unequal variances) is very difficult to count. We can approximate it with the help of the following Satterthwaite formula:
Alternatively, you can take the smaller of and as a conservative estimate for the number of degrees of freedom.
🔎 The Satterthwaite formula for the degrees of freedom can be rewritten as a scaled weighted harmonic mean of the degrees of freedom of the respective samples: and , and the weights are proportional to the standard deviations of the corresponding samples.
Paired t-test
As we commonly perform a paired t-test when we have data about the same subjects measured twice (before and after some treatment), let us adopt the convention of referring to the samples as the pre-group and post-group.
-
The null hypothesis is that the true difference between the means of pre- and post-populations is equal to some pre-set value, .
-
The alternative hypothesis is that the actual difference between these means is:
- Different from ;
- Smaller than ; or
- Greater than .
Typically, this pre-determined difference is zero. We can then reformulate the hypotheses as follows:
-
The null hypothesis is that the pre- and post-means are the same, i.e., the treatment has no impact on the population.
-
The alternative hypothesis:
- The pre- and post-means are different from one another (treatment has some effect);
- The pre-mean is smaller than the post-mean (treatment increases the result); or
- The pre-mean is greater than the post-mean (treatment decreases the result).
Paired t-test formula
In fact, a paired t-test is technically the same as a one-sample t-test! Let us see why it is so. Let be the pre observations and the respective post observations. That is, are the before and after measurements of the i-th subject.
For each subject, compute the difference, . All that happens next is just a one-sample t-test performed on the sample of differences . Take a look at the formula for the T-score:
where:
-
— Mean difference postulated in the null hypothesis;
-
— Size of the sample of differences, i.e., the number of pairs;
-
— Mean of the sample of differences; and
-
— Standard deviation of the sample of differences.
Number of degrees of freedom in t-test (paired):
t-test vs Z-test
We use a Z-test when we want to test the population mean of a normally distributed dataset, which has a known population variance. If the number of degrees of freedom is large, then the t-Student distribution is very close to N(0,1).
Hence, if there are many data points (at least 30), you may swap a t-test for a Z-test, and the results will be almost identical. However, for small samples with unknown variance, remember to use the t-test because, in such cases, the t-Student distribution differs significantly from the N(0,1)!
🙋 Have you concluded you need to perform the z-test? Head straight to our z-test calculator!
FAQs
What is a t-test?
A t-test is a widely used statistical test that analyzes the means of one or two groups of data. For instance, a t-test is performed on medical data to determine whether a new drug really helps.
What are different types of t-tests?
Different types of t-tests are:
- One-sample t-test;
- Two-sample t-test; and
- Paired t-test.
How to find the t value in a one sample t-test?
To find the t-value:
- Subtract the null hypothesis mean from the sample mean value.
- Divide the difference by the standard deviation of the sample.
- Multiply the resultant with the square root of the sample size.