Mann-Whitney U Test Calculator
This Mann-Whitney U test calculator is here to help whenever you have to perform the Wilcoxon-Mann-Whitney test. It displays not only the final decision but also the results of intermediate computations so that you can learn how to calculate the Mann-Whitney U test by hand.
If you are not yet familiar with the Wilcoxon-Mann-Whitney test, we've prepared a short article explaining what the Mann-Whitney U test is, what is the correct interpretation of the Mann-Whitney U test, and when to use the Mann-Whitney U test vs. t-test.
💡 The Mann-Whitney U test is sometimes called the Wilcoxon-Mann-Whitney test because this test was first proposed by Wilcoxon and then further developed by Mann and Whitney. This calculator uses the test statistic U. See Omni's Wilcoxon rank-sum test calculator for a version of this test using the sum of ranks as the test statistic.
What is the Mann-Whitney U test?
The Mann-Whitney U test is a statistical procedure that we use when we have two independent samples and we want to decide if they come from the same distribution (thus also if the medians of the two populations are equal) or rather from shifted distributions.
If you're not sure what median is, make sure to visit our median calculator to learn a bit about this concept before plunging into the U-test.
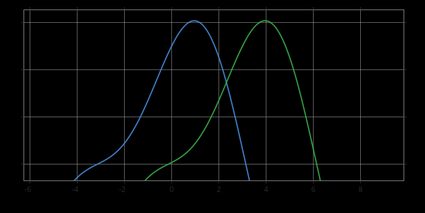
In the picture below, you can see an example of shifted distributions: the blue probability density function is shifted to the left with respect to the green one. As a consequence, the median of the blue distribution is smaller than the median of the green one.
OK, now that we know what the Mann-Whitney U test is, let's move on and discuss when this test can help us.
Mann-Whitney U test vs. t-test
Recall that the t-test is a statistical procedure that helps you decide if the population means for two independent samples are equal. However, the t-test has its assumptions; in particular, it requires that at least one of the following conditions holds:
- Each sample is normally distributed.
- The samples are relatively large. Optimally, they would have more than 30 or 50 points each, depending on the source. This allows us to resort to the central limit theorem.
However, life is tough sometimes, and from time to time, we encounter datasets that do not want to obey the assumptions of the t-test. For instance, data may be skewed (like in the lognormal distribution), or there may be too few data points. And that's exactly when we use the Mann-Whitney U test.
Let us now discuss the interpretation of the Mann-Whitney U test.
Or maybe you want to learn more about the t-test? We have a dedicated t-test calculator!
Mann-Whitney U test interpretation
As we've already mentioned, the null hypothesis of the Mann-Whitney U test says that the two populations (we'll refer to them as A and B) have the same distribution. Clearly, in such a case, the two populations have equal medians. Rejecting the null hypothesis means we have evidence that the population distributions are shifted with respect to each other, and so are their medians. As in the t-test, there are three possible alternatives:
-
The distribution of A is shifted to the right with respect to the distribution of B. That is, the median of population A is greater than the median of population B. We'll denote this alternative by A > B.
-
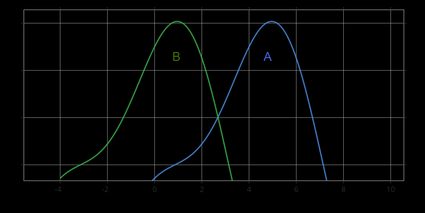
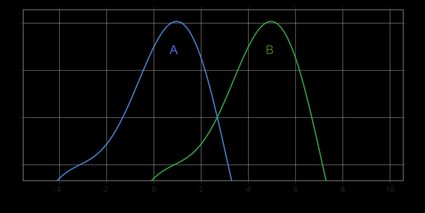
The distribution of A is shifted to the left with respect to the distribution of B. That is, the median of population A is smaller than the median of population B. We'll denote this alternative by A < B.
-
The distribution of A is shifted to the right or to the left with respect to the distribution of B. That is, the median of population A is different from the median of population B. We'll denote this alternative by A ≠ B.
The pictures below show the hypothesis A > B (upper figure) and the hypothesis A < B (bottom figure):
Most of the time, we perform the two-sided test, i.e., with the alternative A ≠ B. Use a one-sided test if you have some prior theory suggesting that the shift between the populations occurred in a specific direction.
How do I use this Mann-Whitney U test calculator?
- Enter your data in the fields of the calculator. Additional fields will appear as you go. Up to 50 fields per sample are available.
- Pick the significance level and the alternative hypothesis of your test. If not sure, leave the default values.
- The results of the Mann-Whitney U test will appear at the bottom of the calculator.
- If at least one of the samples has more than
20elements, the calculator uses the normal approximation by default. Otherwise, it performs the exact Mann-Whitney U test, but you can use the normal distribution by adjusting theUse normal approximationoption. - If the calculator uses the normal approximation of the test statistic distribution, then you can choose between the p-value approach and the critical region approach.
- In the
Advanced modeof the calculator, you can decide whether to use the corrections for ties and continuity. Visit our Wilcoxon rank-sum calculator to learn more about them.
Mann-Whitney U is quite popular on tests and exams, so that it may happen you'll need to learn to perform this test by hand. That's why we'll now show you the Mann-Whitney U test formula and explain step-by-step how to calculate the Mann-Whitney U test!
How to calculate the Mann-Whitney U test?
To perform the Mann-Whitney U test, follow these steps:
-
Compute the test statistics: compare each observation from Sample A with each observation from Sample B. Count how many times an observation from Sample A is the bigger one: each instance is worth 1 point. Each tie is worth 0.5. Otherwise, it's zero points. Then add the points — this is the test statistic U.
-
If your samples are small, you have to compare U with the critical value, which you can find in statistical tables or in statistical packages.
-
If your samples are relatively large, you can use the normal approximation of the test statistic distribution. In such a case, you can make the decision based on the p-value.
Let's discuss these instructions in more detail. In what follows, we denote by n₁ and n₂ the number of observations in Sample A and Sample B, respectively, and by n, the total number of observations, i.e., we have n = n₁ + n₂.
How to compute the test statistic
The test statistic in the Mann-Whitney U test is given by the following formula:
U₁ = ∑i∑ⱼ S(Ai, Bⱼ),
where Ai and Bj are our observations (so i = 1, ..., n₁ and j = 1, ..., n₂) and:
- S(Ai, Bj) = 1, if Ai > Bj;
- S(Ai, Bj) = ½, if Ai = Bj; and
- S(Ai, Bj) = 0, if Ai < Bj.
Clearly, U₁ has a discrete distribution and:
- Its minimal possible value is 0 — when every observation from Sample B is bigger than every observation from Sample A.
- Its maximal possible value is n₁n₂ — when every observation from Sample A is bigger than every observation from Sample B.
Alternatively, we can compute U₁ via the following formula:
U₁ = R₁ − n₁(n₁ + 1)/2
where R₁ is the sum of ranks in Sample A. This formula says that two test statistics, U₁ and R₁, which appear in the context of the Mann-Whitney-Wilcoxon test, can be easily computed from one another.
💡 Visit Omni's Wilcoxon rank-sum calculator to learn more about ranks.
Critical values for the Mann-Whitney U test
As is always the case in hypothesis testing, the critical value (and also the direction of comparison) depends on the alternative hypothesis:
-
If A > B, then the observations from Sample A tend to be greater than those from Sample B. Hence, we have evidence in favor of this alternative if U₁ is unusually large, and so the critical region is right-sided, i.e., [c, ∞), where c is the critical value. Considering the maximal possible value of U₁, we actually obtain [c, n₁n₂].
-
If A < B, then the observations from Sample B tend to be greater than those from Sample A. Hence, we have evidence in favor of this alternative if U₁ is unusually small, and so the critical region is left-sided, i.e., (∞, c], where c is the critical value. Considering the minimal possible values of U₁, we obtain [0, c].
-
If A ≠ B, then U₁ is extreme, i.e., unusually small or unusually large. Hence, the critical region is two-sided, i.e., (-∞, c₁] ∪ [c₂, ∞), where c₁ and c₂ are the critical values. Taking into account the minimal and maximal possible values of U₁, we obtain [0, c₁] ∪ [c₂, n₁n₂].
We can determine the actual values of the critical values c, c₁, c₂ from the distribution of U₁, and they depend on n₁, n₂, and on the significance level. To find them, you have to use either a statistical package or the tables of the distribution of U statistics. Or Omni's Mann-Whitney U test calculator 😉!
Using the normal approximation
As we've seen above, it's important to know the distribution of the test statistic to find the critical values. Sometimes, however, it's much easier to use some approximations. In particular, the U statistic can be well approximated by the normal distribution if your samples have sufficiently many observations. Some sources say that even 5 observations per sample is fine, but, obviously, the more the better. The parameters of the normal distribution are the following:
-
mean: μ = n₁n₂ / 2; and
-
standard deviation: σ = √(n₁n₂(n₁ + n₂ + 1) / 12).
Hence, the normalized test statistic:
z = (U₁ - μ) / σ
follows the standard normal distribution N(0,1). Knowing the z-score, we can now use the p-value calculator and draw some conclusions.
Hurray! You now know how to calculate the Mann-Whitney U test 🎉!
FAQ
When to use the Mann-Whitney U test?
Use the Mann-Whitney U test to verify if two populations have equal medians whenever your samples are not normally distributed, or they have relatively few elements. Remember that, in such a case, you cannot use the t-test!
What is the difference between the Mann-Whitney U and Wilcoxon rank-sum tests?
The Mann-Whitney U and Wilcoxon rank-sum tests are, in fact, one and the same test. That's why people sometimes call it the Mann-Whitney-Wilcoxon test. Although you can encounter two different test statistics (sum of ranks and U-statistic), it turns out they are closely related. No matter which test statistic you use, the test's conclusions are going to be the same.
What are the assumptions of the Wilcoxon-Mann-Whitney test?
The Mann-Whitney U test has the following assumptions:
- There is one independent variable that is a dichotomous variable, that is, it has two categories. For instance, sex (male/female) or trial (intervention/control). These categories are mutually exclusive.
- The dependent variable should be measured on a continuous or ordinal scale. For instance, Likert items fulfill this assumption.
- The last assumption of the Wilcoxon-Mann-Whitney test is that the observations have to be independent.
- Importantly, your sample does not have to follow the normal distribution. This is the main advantage of the Mann-Whitney U test vs. t-test.