This Pearson correlation calculator helps you determine Pearson's r for any given two variable dataset. Below, we explain what Pearson correlation is, give you the mathematical formula, and teach how to calculate the Pearson correlation by hand. You can also discover the link between Pearson's r and linear regression, as well as finally understanding what that common saying, "correlation does not equal causation", means.
Interested in other correlation coefficients? Visit Omni's Spearman's rank correlation calculator!
What is the Pearson correlation coefficient?
The Pearson correlation measures the strength and direction of the linear relation between two random variables, or bivariate data. Linearity means that one variable changes by the same amount whenever the other variable changes by 1 unit, no matter whether it changes e.g., from to , or from to .
A simple real-life example is the relationship between parent's height and their offspring's height - the taller people are, the taller their children tend to be.
The Pearson correlation coefficient is most often denoted by r (and so this coefficient is also referred to as Pearson's r).
Interpretation of the Pearson correlation
-
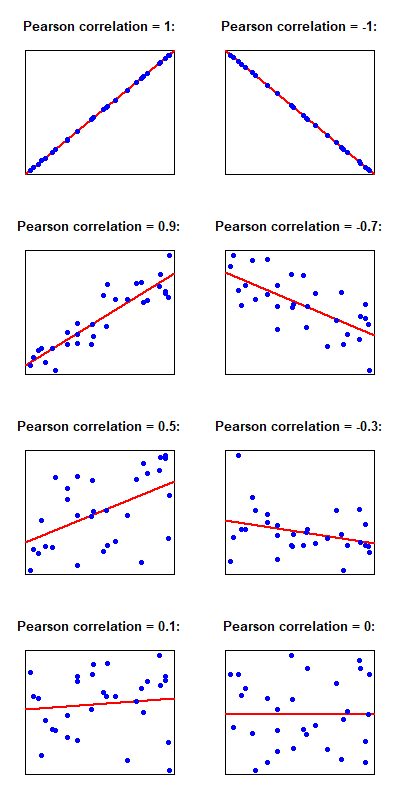
The sign of the Pearson correlation gives the direction of the relationship:
- If r is positive, it means that as one variable increases, the other tends to increase as well; and
- If r is negative, then one variable tends to decrease as the other increases.
-
The absolute value gives the strength of the relationship:
- Pearson's r ranges from to ;
- The closer it is to , the stronger the relationship between the variables;
- If r equals or , then the linear fit is perfect: all data points lie on one line; and
- If r equal , it means that no linear relationship is present in the data.
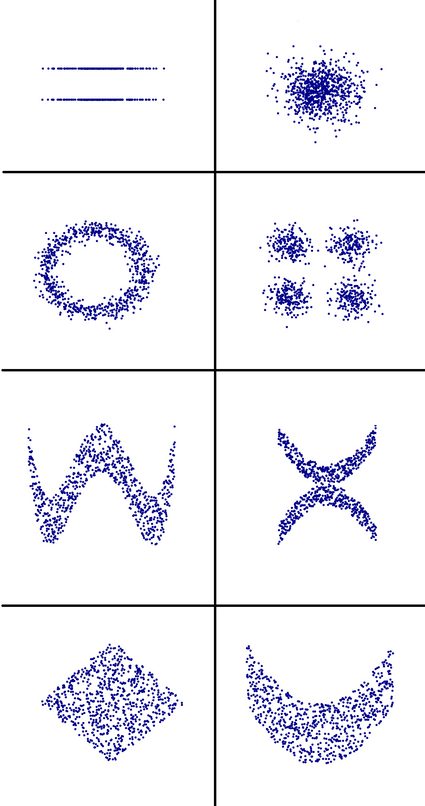
Remember that Pearson correlation detects only a linear relationship! For coefficients that can detect other types of relationship, see our correlation calculator.
This means that a low (or even null) correlation doesn't mean that there is no relationship at all! Take a look at the eight data sets below: they all have a Pearson correlation coefficient equal to zero.
How to use this Pearson correlation calculator
Just input your data into the rows. When at least three points (both an x and y coordinate) are in place, our Pearson correlation calculator will give you your result, along with an interpretation.
The verbal description of the strength of correlation returned in this calculator employs Evan's scale (1996) for the absolute value of r:
- very strong
- strong
- moderate
- weak
- very weak
You may encounter many other guidelines for the interpretation of the Pearson correlation coefficient. Bear in mind that all such descriptions and interpretations are arbitrary and depend on context.
Pearson correlation formula and properties
It is high time we gave the mathematical formula for the Pearson correlation. Formally, Pearson's r is defined as the covariance of two variables divided by the product of their respective standard deviations. This translates into the following formula:
which can be further rewritten as:
-
It can be proven (via the Cauchy–Schwarz inequality) that the absolute value of the correlation coefficient never exceeds .
-
Note that the correlation is symmetric, i.e., the correlation between and is the same as between and .
-
Correlation vs. independence. If the variables are independent, their correlation is , but, in general, the converse is not true! There is, however, a special case: when and are jointly normal (i.e., the random vector follows a ) and uncorrelated, then independence follows.
Since we have mentioned covariance, you can visit the covariance calculator for more insights regarding this statistical quantity.
How to calculate Pearson correlation by hand
In case you wanted to better understand how the Pearson correlation formula works, we have prepared a way for you to compute Pearson's r by hand. Suppose we have the data set:
,
so the x-values are , and the respective y-values are .
- Count how many points there are:
- Calculate the mean (arithmetic average) of the and values:
- Calculate the sums of the squares of and , and their dot-products:
- We have all the values needed to apply the formula:
because
and
- Finally, we can compute the value of the Pearson correlation coefficient:
Pearson's r and R-squared in simple linear regression
In simple linear regression (), the Pearson correlation is directly linked to the coefficient of determination (R-squared), which expresses the fraction of the variance in that is explained by :
-
The R-squared can be calculated by simply squaring the Pearson correlation coefficient.
-
The slope of the fitted regression line can be found, as the Pearson correlation between and multiplied by the ratio of their respective standard deviations gives the gradient: .
If you want to perform linear regression on your data, check the least squares regression line calculator to find the best fit of and parameters.
"Correlation does not equal causation"
Always remember that even a very strong correlation between two variables does not mean there's a causal link between the variables. It could be random chance, or there may be some other intervening variable that affects both your variables.
For example, the demand for sunglasses is strongly positively correlated with the rate of people drowning. This does not mean that sunglasses force anybody underwater! Instead, we rather suspect that hot weather causes both of these variables to increase.