Omni built this Spearman's correlation calculator so that you will never have to worry about how to calculate rank correlation again. If you're not yet sure what Spearman's rank correlation coefficient is all about, we've prepared a short article that explains everything you need to know about this popular statistical notion. We also discuss the properties of Spearman's rank correlation coefficient.
Hey, there are also several other coefficients of correlation! Discover them all with our correlation coefficients calculator.
What is Spearman's rank correlation coefficient?
Spearman's rank correlation is a statistical method of measuring the strength and direction of the monotonic relationship between two variables. In other words: as one variable increases, does the other variable tend to increase as well (this is a positive correlation), or does it rather tend to decrease (negative correlation)?
Let's discuss the difference between Spearman's rank correlation and its more popular colleague - Pearson's correlation - a bit more.
What is the difference between Spearman and Pearson correlations?
Both Spearman and Pearson correlation coefficients quantify the strength (and direction) of the association between two variables. It's vital you remember that these two differ in the kind of association they are sensitive for:
- Pearson correlation assesses linear relationships. It only works for continuous variables and is based on your data's raw values.
- Spearman's correlation determines monotonic relationships, be they linear or not. It works for continuous or ordinal variables. It relies on the ranked values for each of these variables.
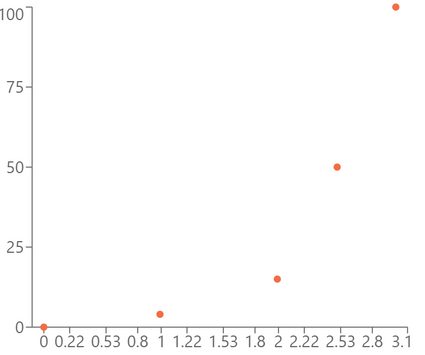
For example, the scatter plot below shows an association that is monotonic but not linear - Pearson’s correlation for this data set is equal to 0.85, while its Spearman’s rank correlation is 1, indicating a perfect monotonic relationship.
Now that we have a basic idea of what Spearman's rank correlation coefficient is and what type of association it measures, let's discuss in more depth the math behind it. This will allow us to understand the various properties of Spearman's rank correlation coefficient better.
Definition and formula for Spearman's rank correlation
We define Spearman’s rank correlation coefficient between two variables X and Y as the Pearson's correlation between the rank variables r(X) and r(Y), i.e., the covariance between these rank variables divided by the product of their respective standard deviations. That is, the following is the formula for Spearman's rank correlation ρ:
🙋 Visit our Pearson correlation calculator, covariance calculator and standard deviation calculator if you're not yet familiar with these crucial concepts in statistics!
What are rank variables?
Ranking observations from lowest to highest is necessary in many statistical procedures. However, if you've never heard about it before, here's a quick instruction.
In principle, ranking observations is trivial: the lowest observation gets rank , the second-lowest gets rank , and so on, all the way up to the highest observation. However, you need to be careful when there are ties - that is, if the same value appears in the data set more than once. In such a case, we assign the same rank to all the identical observations, and this rank is equal to the arithmetic mean of the ranks you would assign to these observations were they all had different values.
For instance, imagine we have already assigned ranks , , and to the three lowest values in our data set, and then we see that the next lowest value appears twice. These two observations would take ranks and , so to find their common rank, we compute the average of and : . So the rank we assign to our two observations is . As you can see, this rank is not an integer, but this is fine.
Alternative formula
If there are no ties, then there's an alternative, much simpler, formula for Spearman's rank correlation coefficient:
where
- — Number of observations (data points); and
- — Difference in ranks between and , that is .
⚠️ If there are ties, the above formula is incorrect!
How to use this Spearman's correlation calculator?
To use our Spearman's rank correlation calculator, just input your data into the rows. When at least three points (both an x and y coordinate) are in place, it will give you your result, along with an interpretation of the strength of correlation. For the latter task, our Spearman's correlation calculator uses Evan's scale (1996) for the absolute value of :
- very strong;
- strong;
- moderate;
- weak; and
- very weak.
As you can see, even though the formula for Spearman's correlation is a bit complicated, you no longer need to wonder how to calculate Spearman's rank correlation - with the help of Omni's Spearman's correlation calculator, it's a piece of cake!
How to calculate rank correlation? Step-by-step example
In this section, we show you step-by-step how to calculate Spearman's correlation coefficient by hand.
- Assume we have the following data
xi | yi |
|---|---|
1 | 0 |
2 | 8 |
3 | 3 |
4 | 2 |
5 | 4 |
- The first step is to rank the observations. Let's start with the
xsample. As we can see, it's really, really simple to rank this sample!
xi | yi | r(xi) |
|---|---|---|
1 | 0 | 1 |
2 | 8 | 2 |
3 | 3 | 3 |
4 | 2 | 4 |
5 | 4 | 5 |
- Let's move on to the
ysample. There's a bit more work to do, but we'll manage, won't we?
xi | yi | r(xi) | r(yi) |
|---|---|---|---|
1 | 0 | 1 | 1 |
2 | 8 | 2 | 5 |
3 | 3 | 3 | 3 |
4 | 2 | 4 | 2 |
5 | 4 | 5 | 4 |
- As we can see, there are no ties in our samples. This means we can use the formula that uses differences in ranks. Let's calculate them for each pair of observations.
xi | yi | r(xi) | r(yi) | di |
|---|---|---|---|---|
1 | 0 | 1 | 1 | 0 |
2 | 8 | 2 | 5 | -3 |
3 | 3 | 3 | 3 | 0 |
4 | 2 | 4 | 2 | 2 |
5 | 4 | 5 | 4 | 1 |
- Recall the formula we want to use:
Plugging in our data, we obtain:
Finally, we have:
The last thing we want to discuss is the question dreaded by so many students: "What does Spearman's rank correlation coefficient mean?" In the last section, we'll lead you safely through the problem of interpreting the value of Spearman's correlation.
What does Spearman's rank correlation coefficient mean?
Spearman's rank correlation:
- Has positive value if the two variables tend to increase (or decrease) simultaneously. The higher the value of one variable, the higher the value of the other variable.
- Has negative value if one variable tends to increases as the other variables decreases. The higher the value of one variable, the lower the value of the other variable.
- Equals 1 if there is a perfect increasing relationship, so if one variable increases, then the other also increases (with 100% probability).
- Equals -1 if there is a perfect decreasing relationship, so if one variable increases, then the other decreases (with 100% probability).
- Is close to zero if the monotone relationship between the two variables is weak.
- Is far from zero if the monotone relationship between the two variables is strong.
- Equals zero if there is no monotonic relationship between the variables. However, this doesn't mean that there is no relationship whatsoever - there can be some other type of relationship.
For instance, the data set below has Spearman's rank correlation equal to zero, so there's no monotonic relationship between these variables. However, as we can all see, they have a perfect quadratic relationship!

FAQs
What values can the Spearman's correlation coefficient take?
Spearman's correlation coefficient can take values between -1 and 1. This is because Spearman's rank correlation is defined as Pearson correlation of ranked variables, and via the Cauchy-Schwarz inequality, we can prove that the absolute value of Pearson correlation cannot exceed one, and thus the same holds for Spearman's correlation.
How do I calculate Spearman's rank correlation by hand?
Here's how to calculate rank correlation by hand:
-
Separately rank the two data sets from biggest to smallest. If there are tied values, assign them the average rank of their positions.
-
Compute the covariance of ranks between the two sets and their respective standard deviations.
-
Spearman's rank correlation coefficient is equal to this covariance divided by the product of standard deviations.
-
Alternatively, if there are no ties, use the formula:
1 - 6 ∑ di2 / [n(n2 - 1)]
where di = r(xi) - r(yi) is the difference in ranks.