If you have two samples and you want to determine if they vary in a similar way, this covariance calculator is the tool you need. Here, you will learn how the covariance formula works, how to calculate covariance, and understand the covariance vs correlation relationship.
First, to answer the question: What is covariance?
📊 Your Real-World Statistics Resource Hub
Discover our full that includes expert articles and reports — all in one place!
Popular reads:
What is covariance?
If X and Y are two random variables with expected values, and respectively, their covariance is:
This covariance formula can further be simplified to:
The above formula is not practical in real-life situations, as it relies on us knowing the expected values for X, Y, and XY. The only way to discover these numbers is by knowing how the random variables X, Y, and X*Y are distributed. But you usually don't know that. On the contrary, this is something you want to discover!
Instead, we use sample observations of x and y over a finite size, n. We will see that this is actually enough to perform one of the following two tasks:
-
Find the covariance of X and Y when we have access to the whole population data.
-
Find an estimate of the population covariance for X and Y when we only have access to a sample.
Covariance formula explained
So, each of the two samples, x and y, consists of n randomly observed values, X and Y, respectively. The elements of the first sample are denoted by , and their average by . Similarly, the elements of the second sample are , with an average of .
The following formula is the population covariance formula for two equally sized samples:
The name here comes from the fact that we regard our two samples are all there is, i.e., they constitute our populations. We do not care here what happens outside of these samples.
The usefulness of the covariance formula is not immediately clear. Let's break it down to parts to understand it better.
Remember that n represents the sample size of each of the two samples. For each , the terms and calculate the differences between the sample elements and the sample average.
In the covariance formula, these two terms are multiplied, then summed over all sample elements, and finally averaged by dividing by , the size of each of the samples. Phew!
Don't be scared, though! The idea behind the covariance formula is actually pretty simple: we want to measure how much the data from the two samples vary together.
Don't worry, we've prepared an example to make things much easier to understand.
Example on how to calculate covariance
We will now dig a bit deeper into the calculation's details by looking at how the covariance formula works in a real-life example.
John is an investor who just bought his first few stocks in "Cool Places", a company specialising in polar vacations. But, as every smart investor knows, John should diversify his portfolio, so he decided to buy some stocks in either "Star Dust" and "Time Travel Vacations", two more travel agencies. But he can't decide which stocks to buy. What should he do?
Well, the covariance formula may have the answer! John randomly selects five daily closing prices, not necessarily in chronological order, for the stocks of "Cool Places" and "Star Dust", denoted by and , respectively:
i | xi | yi | xdiff | ydiff | xdiff * ydiff |
|---|---|---|---|---|---|
1 | 12.76 | 7.06 | 0.094 | 0.044 | 0.004 |
2 | 12.35 | 6.81 | -0.316 | -0.206 | 0.065 |
3 | 12.43 | 6.88 | -0.236 | -0.136 | 0.032 |
4 | 12.70 | 6.98 | 0.034 | -0.036 | -0.001 |
5 | 13.09 | 7.35 | 0.424 | 0.334 | 0.142 |
mean | 12.666 | 7.016 |
Here is a step-by-step calculation:
-
Calculate the average of the "Cool Places" stock closing prices by adding up the values in the second column and by dividing the sum by the sample size of . Do the same for "Star Dust" stock prices in the third column:
and .
-
Complete the fourth and fifth columns by subtracting the corresponding averages and from the stock prices listed in the rows: and .
-
Fill out the sixth column by simply multiplying the corresponding numbers from the fourth and fifth columns.
-
Finally, when you sum up all the numbers in the sixth column and divide the sum by the sample size, in this case, , you get the sample covariance:
!
Check this result by using the covariance calculator and read on to find out how to interpret this number.
How to interpret the covariance
Note that the covariance value does not have a particular significance by itself, although there are some essential comments we can still make.
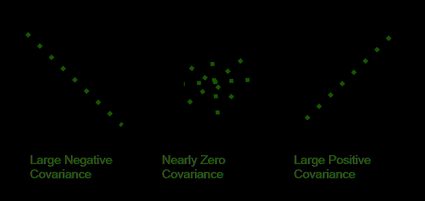
If the covariance is positive, the observation of the two samples tends to exhibit similar behavior with respect to their averages. Either they are both higher than their corresponding means, or they are both lower. So, the way they vary from their averages is similar.
In the case of negative covariance, the samples behave in the generally opposite manners. When one observation is lower than its sample's average, the corresponding observation of the other sample is higher than its average, and vice versa. But, we can say the samples are still related, although in a different way than in the case of the positive covariance.
Also, the further the covariance is from zero, the more related the samples are, while a covariance value closer to zero suggests there isn't a strong relationship between sample variations:
What does this mean for John's diversification strategy? He will probably be better off if he buys stocks whose prices have a covariance close to zero when compared to the stocks he already has. Why? Because then he'll know that the second stock is less likely to vary simultaneously with the first one.
However, to make the right decision, he still needs to calculate the covariance of the observed closing prices for the stocks of "Cool Places" and "Time Travel Vacations".
Use the sample covariance calculator on the following data, where still represents "Cool Places", but this time is the "Time Travel Vacations" closing prices:
i | xi | yi |
|---|---|---|
1 | 12.76 | 17.12 |
2 | 12.35 | 16.35 |
3 | 12.43 | 19.21 |
4 | 12.70 | 19.75 |
5 | 13.09 | 17.52 |
Now we get a sample covariance equal to , which is a much lower covariance than the one for "Cool Places" and "Star Dust". John concludes that he should buy the "Time Travel Vacations" stocks in order to diversify his portfolio effectively.
How to estimate the population covariance from samples
In practical situations, the sample to which we have access represents a larger population. Thankfully, even from limited samples, we can estimate the covariance in the whole population via the following formula:
The name here comes from the fact that we regard our two samples are parts of larger populations. Based on the samples we want to describe what happens in the bigger world.
You can see that the denominator here is n-1, which will give a somewhat higher result than the original covariance formula. We intuitively do expect this to happen, as limited samples generally don't reflect the total variability between entire populations and it can be shown rigorously that the denominator n-1 is the right corrective factor.
The relationship between sample and population covariances is given by the formula:
But, bear in mind that, as the size of the samples gets bigger, the difference between n and n-1 gets smaller. So the original sample covariance formula and population covariance estimate give similar results for large samples.
You can check out what would be the results for John's stocks if we have, instead of the original formula, used the estimation formula for sample covariance.
Variance and correlation vs covariance
Covariance is a measure of variability between two random variables, X and Y, while variance measures how much a particular random variable varies by itself. If you'd like to learn more details, visit our variance calculator.
Here is the relationship between these two quantities:
So, the variance of X is precisely the covariance between X and itself! To learn more, check out our detailed article: Covariance vs. Variance: Key Differences Explained.
Another way to express the variability between two random variables is by the correlation between random variables X and Y. The relation between correlation and covariance is:
where and are the standard deviations of the random variables X and Y.
You can think of correlation as the normalized version of covariance: the above formula guarantees that correlation must be somewhere between the numbers -1 and 1. This property is the reason why correlation is more often and more readily used than covariance, although they do similar jobs.
Remember that in the example with John, we had the problem of interpreting how large or small the covariance is? Well, with correlation, you wouldn't have that issue.
It may be useful to note that there are various types of correlation. If you're interested in them, check out our dedicated calculators:
References