This is the least squares regression line calculator – a user-friendly tool that answers the question "How to find the line of best fit?". If you are wondering how to find the average rate of change for a car that is increasing its velocity, then you are in the right place!
In the article, you can also find some useful information about the least squares method, how to find the least squares regression line, and what to pay particular attention to while performing a least squares fit.
You may also want to try our linear regression calculator, which estimates linear regression via projection matrix.
How to find the line of best fit
Intuitively, you can try to draw a line that passes as close to all the points as possible. Sometimes, it can be a straight line, which means that we will perform a linear regression. There are multiple methods of dealing with this task, with the most popular and widely used being the least squares estimation. Here we have some real-life examples:
The faster you drive, the more combustion there is in your car's engine. Maybe the winter is freezing cold, or the summer is sweltering hot, so you need to buy more electricity to use for heating and air conditioning. You can imagine many more similar situations where an increase in A causes the growth (or decay) of B.
Why do we use it? Well, with just a few data points, we can roughly predict the result of a future event. This is why it is beneficial to know how to find the line of best fit. In the case of only two points, the slope calculator is a great choice. It'll help you find the ratio of B and A at a certain time.
Unlike the standard ratio, which can deal only with one pair of numbers at once, this least squares regression line calculator shows you how to find the least squares regression line for multiple data points.
Least squares regression line equation
To make everything as clear as possible – we are going to find a straight line with a slope, a, and intercept, b. The formula for the line of the best fit with least squares estimation is then:
y = a ⋅ x + b
As you can see, the least squares regression line equation is no different from linear dependency's standard expression. The magic lies in the way of working out the parameters a and b.
Great! So what does the least squares really mean? Jump to the next section to find out!
Least squares method
Do you wonder how to find the line of best fit using the least squares method? The idea is simple:

-
Draw a straight line: f(x) = a·x + b.
-
Evaluate all of the vertical distances, dᵢ, between the points and your line: dᵢ = |yᵢ - f(xᵢ)|.
-
Square them: dᵢ².
-
Sum them together, Z = ∑dᵢ² = d₁² + d₂² + d₃² + ….
-
Find a line such that the value of Z becomes as little as possible.
-
Enjoy knowing the origin of the name of the least squares method.
It might sound a bit vague at first glance, so to clarify things, let's take a look at some pictures. There are three different lines fitted for the same data points, (1,2), (2,6), (3,4), (4,7):
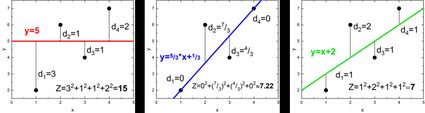
As you can see, Z has different values in each case. It's minimal for the third plot, but can we do even better? Use our least squares regression line calculator to find out if that's the most optimal solution!
How to find the least squares regression line
Or, in other words, how does our least squares regression line calculator work? We want to estimate the regression line parameters a and b. In the standard least squares method, we can work out a few auxiliary values which will simplify the final formula:
- Sx = ∑xᵢ = x₁ + x₂ + x₃ + … ;
- Sy = ∑yᵢ = y₁ + y₂ + y₃ + … ;
- Sxx = ∑xᵢ² = x₁² + x₂² + x₃² + … ;
- Syy = ∑yᵢ² = y₁² + y₂² + y₃² + … ;
- Sxy = ∑xᵢyᵢ = x₁y₁ + x₂y₂ + x₃y₃ + … ; and
- Δ = n·Sxx - Sx².
where n is the total number of points. The least-squares fit emerges from these coefficients:
- a = (n·Sxy - Sx·Sy) / Δ;
- b = (Sxx·Sy - Sx·Sxy) / Δ.
By solving these formulas, you receive some numerical values. But is there a way to decide how many significant digits we should include? Estimating the error of these parameters (in this case, the standard deviations) will be handy:
Now, look at the two significant digits from the standard deviations and round the parameters to the corresponding decimals numbers. Remember to use scientific notation for really big or really small values.
In the end, we can also find the Pearson correlation coefficient, :
The absolute value of can span from 0 to 1. The closer it gets to unity (1), the better the least squares fit is. If the value heads towards 0, our data points don't show any linear dependency. Check Omni's Pearson correlation calculator for numerous visual examples with interpretations of plots with different values.
A small remark: We assume there is a normal distribution of y values around real dependency, which we try to reproduce with our regression line.
Least squares fit limitations
Although the least squares method is prevalent and widely used, we should keep in mind that it may be imperfect and misleading in a few cases. These are the most common factors that influence the quality of the least squares estimation:
-
In general, the more points in your data, the better the accuracy of the least squares fit.
-
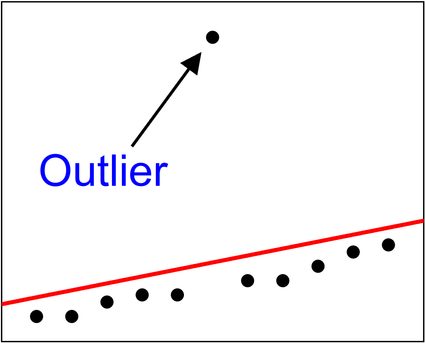
The method is susceptible to outliers. A single point that clearly doesn't fit the overall tendency will affect and distort the result. If it's possible, consider removing such points from your dataset, or try to use the weighted least squares method, so the significance of these points decreases.
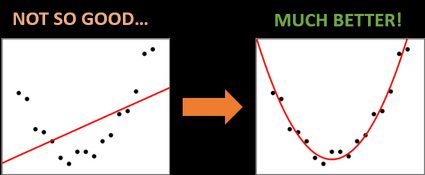
- Sometimes, you can easily spot that your data points follow some non-linear relation (quadratic, cubic, polynomial, exponential, logarithmic, etc.). Well, you can fit a straight line to whatever you want, but in these cases, it's worth considering a parabola, or other corresponding functions, as the fitting curve.
💡 To learn more about assessing how good the linear fit is, check out Omni's R squared calculator and residual calculator.
FAQs
How can I calculate the mean square error (MSE)?
You can calculate the MSE in these steps:
- Determine the number of data points (
n). - Calculate the squared error of each point:
e2 = (y - predicted_y) 2 - Sum up all the squared errors.
- Apply the MSE formula:
sum of squared error / n
Why use the least squares method?
The least squares method provides the best linear unbiased estimate of the underlying relationship between variables. It's widely used in regression analysis to model relationships between dependent and independent variables.
Can the least squares regression line be used for non-linear relationships?
While specifically designed for linear relationships, the least squares method can be extended to polynomial or other non-linear models by transforming the variables.
What is the squared error if the actual value is 10 and the predicted value is 12?
The squared error will be 4. You can calculate this using this formula:
squared error = (actual value - predicted value) 2.