This IQR calculator finds the interquartile range of a set of up to 50 values, helping you understand the spread and distribution of your dataset. The article below explains the interquartile range definition, how to find the interquartile range using the IQR formula, and shows a fully worked example of calculating the interquartile range.
What is interquartile range? — What is IQR?
You may have heard the term interquartile range and asked yourself, "What is interquartile range anyway?" The interquartile range (IQR) of a dataset tells us how bunched up or spread out its values are (it's a measure of variability). Other names you may come across for IQR include midspread, middle 50%, and H-spread.
An important use for IQR is in calculating the dataset's upper and lower fence, which indicates which of the dataset's values are outliers.
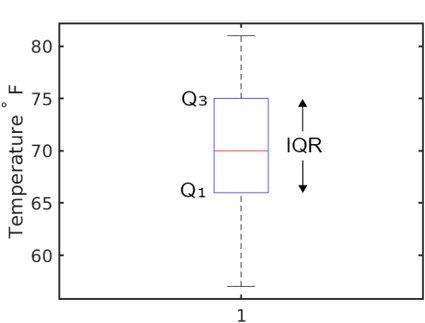
IQR is the difference between the 75th percentile ( upper quartile — ) and the 25th percentile (lower quartile — ). Therefore the IQR formula is:
This equation is how to calculate IQR and is the interquartile range definition. On a box plot, the IQR is shown as the main body of the plot (the box's height). Here is an example of a box plot to demonstrate:
Here's another way to explain the upper and lower quartile values. The data is first divided in half at the median point. Take the lower part of the dataset and find its median value. That's the lower quartile value, . To find the upper quartile, , take the upper part of the data and find its median.
Don't confuse the interquartile range with the similarly named range of a dataset. The range is the difference between the maximum and minimum values — as explained in the range calculator.
So, now that we've answered the question "What is interquartile range?", let's find out how to calculate it from a set of raw numbers.
How to find the interquartile range - How to calculate IQR
To find the interquartile range, we first have to find the upper and lower quartile values. This task isn't as straightforward as you would think, as Wikipedia lists and the R programming language implements .
🙋 The 5 number summary calculator explains the upper and lower quartiles using a practical example, which may make it easier to grasp.
In this IQR calculator, we use method 4 listed on Wikipedia, which interpolates between data values. This interpolation is required if the quartile points fall between values in the dataset.
The first step in finding a quartile is to sort the data into numerical order. This sorting is required for all the different methods.
The second step is to calculate the rank of the upper and lower quartiles, using the following equations:
where:
- — The number of values in the dataset;
- — Lower quartile rank; and
- — Upper quartile rank.
If the rank is a whole number, then the quartile is simply the corresponding value. For example, if the LQR result is 3, then the lower quartile is the 3rd value in the ranked list of values.
However, it is likely that the rank result will be a decimal number and therefore will not match up to a value from the dataset. The interpolation method takes the fractional component of the rank and multiplies it by the difference between the value corresponding to the whole number of the rank and the next ranking value. In equation form, finding the lower quartile looks like this:
where:
- is a value from the ranked list with the subscript indicating the rank;
- is the whole number part of the LQR; and
- is the decimal fraction (the part after the decimal point) of the LQR.
The formula for is similarly:
It's probably best to illustrate these equations with a simple interquartile range example calculation. Let's say a ranked dataset consists of the values , and we would like to find the lower quartile. The lower quartile rank is first calculated by:
Therefore, is and is . We can now plug these numbers into the equation for :
So, we now have a value for the lower quartile range - . Now we use the same method to find the upper quartile:
Having found values for and , we can calculate the interquartile range using the IQR formula:
How to use this calculator to find the IQR
Using this calculator to find the interquartile range of a dataset of up to 50 values is super easy.
- Enter the values from the dataset, one value per row. The calculator requires a minimum of four values before a result is displayed.
- As you enter the values, rows will magically appear for you to add another value.
- Once you have entered a minimum of four values, the results for interquartile range (IQR), Q1, and Q3 are instantly displayed. They will update as you enter more data values.