Welcome to the upper and lower fence calculator, where we'll discuss the use of fences in statistics and show you how to find the lower fence and the upper fence of a dataset. These fences are vital to finding that pesky outlier in your dataset.
What is the upper and lower fence?
Before we can make sense of our upper and lower fence calculator, we must define what fences in statistics mean. The upper and lower fences of a dataset are the thresholds, outside of which values can be considered outliers. Outliers, therefore, are any values that fall below the lower fence or above the upper fence.
The use of fences in statistics
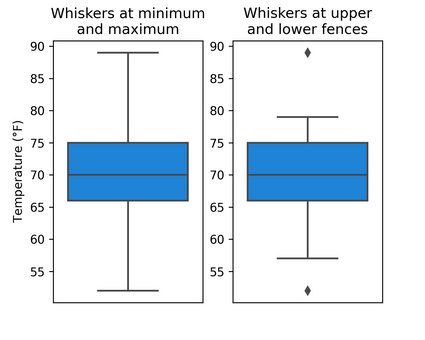
Besides helping us find outliers, fences can be a suitable replacement for the minimum and maximum in descriptive statistics. In most cases, box plots (a helpful tool to visualize a dataset) use the minimum and maximum as the box's whiskers. It's much more insightful, though, to use the upper and lower fences for the whiskers and then indicate outlying values with distinct points. Take a look at the figures below:
How to calculate the upper and lower fence
Now that we know what the fences are, we'd love to know exactly how to find the upper and lower fence. There are a few steps involved, so let's get started!
Before we can get to the upper and lower fence formulas, we need two basic but important values: the dataset's quartiles. We denote the first quartile with and the third quartile with . We can then calculate the interquartile range (IQR) as .
Now that we have the building blocks, how do we find the lower fence, and how do we find the upper fence?
-
The formula for the upper fence is .
-
The formula for the lower fence is .
Some select sources replace the in our formulas with other values, like or sometimes even . The choice of the multiplier is problem-specific and depends on the dataset distribution. An outlier in a dataset of children's heights would still be close to the rest of the dataset, so we'd choose a smaller multiplier like . A millionaire's salary in a dataset of salaries would be much more outlying, so we'd pick a bigger multiplier, like or more. If you'd like to use a different multiplier for your dataset, you can change it in the Results section of our tool by unticking the Use the default multiplier 1.5 check box.
So, there you have it! We've found the formula for the upper fence and the lower fence, and now we can find outliers in any dataset we want.
An example of how to calculate the upper and lower fence
Let's use our upper and lower fence formula in a practical example. Suppose we have a dataset of each year's rainfall volumes for January from 2010 to 2021 in New York, and it looks like this:
, , , , , , , , , , , .
Can you already guess which value is going to be an outlier?
Let's back up that guess with some math.
-
We first have to sort the dataset in increasing order:
, , , , , , , , , , , .
-
We can determine that the dataset's first and third quartiles are and .
-
Using and , we can calculate the interquartile range with
-
Finally, we can use the upper fence formula to get
-
…and we can use the lower fence formula to get
We can look at our data with these upper and lower fences and see that 2017's rainfall of is an outlier. Was your initial guess correct?
How to find the upper and lower fence with our calculator
Our upper and lower fence calculator takes all these steps for you and gives you the fences in the blink of an eye so that you can get to find outliers in your dataset.
-
Enter your dataset's individual values in the rows. You can input up to 50 values.
-
Optionally, change the multiplier used in the fence formulas in the
Advanced mode. -
The calculator will determine the fences and display them at the bottom of the list of values, along with your dataset's outliers and the steps taken to calculate them. Happy outlier hunting!
FAQs
What is an outlier?
Outliers are values in a dataset that differ significantly from other values. The presence of outliers can be a problem, although it depends on what task you're using the data for. Outliers can be legitimate data, like a CEO's salary in a salary dataset. Outliers can also be invalid or due to mistakes; this could be a poorly calibrated sensor, or a typing error made when copying handwritten data over to a spreadsheet.
How do I find outliers?
To find outliers in your dataset, you need to calculate the upper and lower fences of the dataset. You'd then see which of the dataset's values fall outside of the fences — those values are all outliers.
How do I calculate the upper and lower fences?
Multiply your dataset's interquartile range with 1.5, then add and subtract that from your dataset's first and third quartiles, respectively. Those are your upper and lower fences.
What is the upper fence formula?
You can calculate the upper fence with Q₃ + 1.5 × IQR, where Q₃ is your third quartile and IQR is your interquartile range. Any value in your dataset above the upper fence is an outlier.
What is the lower fence formula?
You can calculate the lower fence with Q₁ − 1.5 × IQR, where Q₁ is your first quartile, and IQR is your interquartile range. Any value in your dataset below the lower fence is an outlier.