Welcome to the descriptive statistics calculator. Whether your data set contains grades, rainfall measurements, or stock prices, descriptive statistics will help you analyze and make sense of it. This article will cover what descriptive statistics are, the main purpose of descriptive statistics, and some examples of descriptive analysis in everyday life.
Let's jump right in!
What is descriptive statistics?
"Descriptive statistics" is the collective name for a group of statistics that describe a data set. A singular value from this collection is called a descriptive statistic. Descriptive statistics fill a vital role in handling data sets — they allow us to summarize a data set by its basic features such as…
- Central tendency — where the data set's "middle" is.
- Dispersion — how spread out or huddled near each other the data set's values are.
- Shape — how balanced or skewed the data set is.
What is descriptive analysis?
The definition of descriptive analysis is the use of descriptive statistics to analyze a data set and extract valuable information about it. A descriptive analysis is sometimes called an exploratory data analysis, with the goal of understanding the data set so that we can apply statistical algorithms to it effectively.
How to use the descriptive statistics calculator
If the results are more important to you than the formulas are, you can use our descriptive statistics calculator to get a comprehensive overview of your data set.
- Enter your data set's values. You can enter up to 50 values; the descriptive statistics calculator will automatically show more fields as you fill them.
- Find your data set's descriptive statistics below. The descriptive statistics calculator will combine the stats into its appropriate categories.
💡 Populations vs. samples: A population represents the entire group, while a sample represents a population segment for which you have collected data. This distinction is essential, as the equations for many descriptive statistics change based on this difference.
If you've got a big data set and need to perform more complex calculations than what our descriptive statistics calculator can offer, spreadsheet software such as Microsoft Excel has descriptive statistic capabilities built-in.
Descriptive statistics definitions
Now that we know what descriptive statistics are and what the purpose of descriptive statistics is, we can continue to define them. We'll cover only brief definitions; more information on each statistic can be found by following their links.
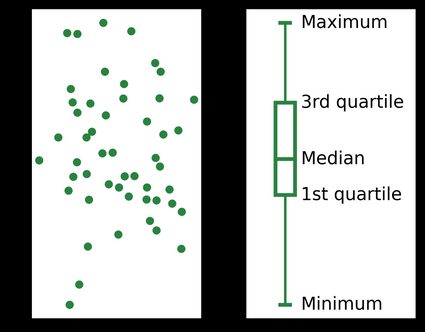
Five-number summary
The five-number summary captures the five most important percentiles:
- The minimum and maximum are the smallest and largest values in your data set.
- The median (also known as the second quartile) is the value that's precisely in the middle of your data set when sorted from least to greatest.
- The first and third quartiles are the values under which 25% and 75% of your data set's values fall when in ascending order.
Five-number summaries are frequently presented graphically with a box plot, like this one:
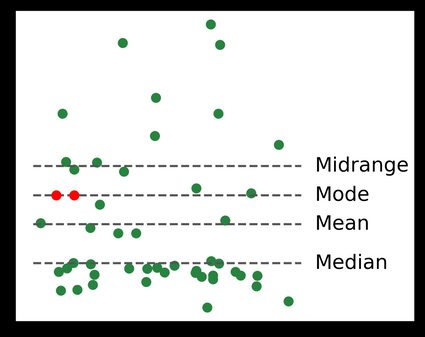
Central tendency
Measures of central tendency are singular values that aim to describe the "middle" of the data set. Depending on the nature of the data, the definition of the "middle" can be any of the following:
- The mean is the sum of all the values in the data set divided by its size.
- The median, which we've already met above.
- The mode is the most frequent value in the data set. A data set can have multiple modes: in a two-way tie for the most frequent value, both values are considered modes of the data set.
- The midrange is the average of the maximum and minimum values.
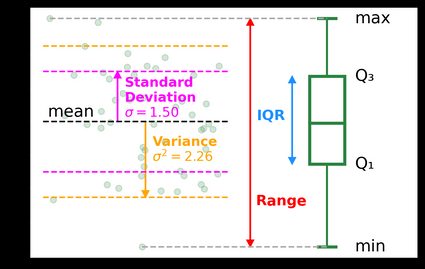
Dispersion
Measures of dispersion describe how spread out the data set is:
- The variance is the sum of squared differences from the mean, divided by the data set's size.
- The standard deviation is simply the square root of the variance.
- The standard error is the standard deviation divided by the square root of the data set's size.
- The range is simply the difference between the data set's minimum and maximum.
- The interquartile range (IQR) is simply the difference between the data set's third and first quartiles.
Outliers
Outliers are values far larger or smaller than the rest of the values in our data set. They may arise due to errors in measurements or they may be perfectly valid data points, but it's always wise to be aware of them.
The upper and lower fences are the thresholds outside of which we consider a data point to be an outlier. Values in our data set that are greater than the upper fence or smaller than the lower fence are outliers.

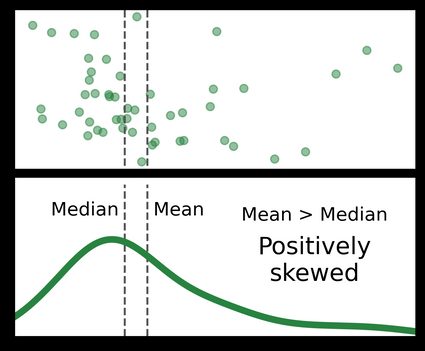
Shape
The shape of a data set refers to the shape its histogram takes on. We can describe the shape with descriptive words such as normally distributed or left- or right-leaning, but we can also describe the shape with quantitative measurements like...
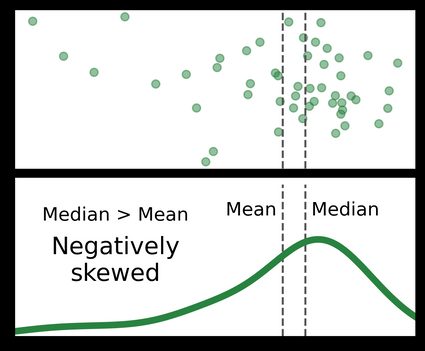
- The skewness of a data set measures how asymmetric it is around its mean.
- A greater skew means the histogram leans more towards one side.
- "Positively skewed" means left-leaning, and "negatively skewed" means right-leaning.
0means the data set is perfectly symmetrical. A dataset needs at least three values to have a skewness. - The kurtosis measures how long the histogram's "tails" are.
- Greater values of kurtosis mean the data set's tails are longer.
Descriptive statistics — examples in everyday life
Descriptive statistics' main purpose is to summarize data and to communicate useful information about it. It's no surprise that we have the saying "on average" — descriptive statistics are ingrained in our language! Examples of descriptive statistics in everyday life include:
- Grade point averages — what was your overall academic performance?
- Cars' gas mileage — how much gas does your car use on average?
- Yearly snowfall averages — does it snow more in cities closer to the Earth's poles?
- Salary averages — are doctors paid more than engineers?
If you want to do a personal experiment, count how many times a day you find averages and other descriptive statistics used in the news and online.
Descriptive analysis example
In this example, suppose we've walked the streets of New York and asked ten people their ages at random. This data is a sample, as we don't have all of New York's inhabitants' ages. The resulting data set looks like this:
Without going into the math behind each of the statistics, here is the resulting descriptive statistics report:
Statistic | Value |
|---|---|
Misc | |
Size () | |
Sum | |
Five-number summary | |
Minimum | |
First quartile () | |
Median () | |
Third quartile () | |
Maximum | |
Central tendency | |
Mean () | |
Mode | |
Midrange | |
Dispersion | |
Variance () | |
Standard deviation () | |
Standard error () | |
Range | |
Interquartile range () | |
Outliers | |
Lower fence | |
Upper fence | |
Outliers | |
Shape | |
Skewness | |
Kurtosis | |
FAQs
What is the difference between descriptive statistics and inferential statistics?
Descriptive and inferential statistics have different goals and methods.
- Descriptive statistics summarize a data set. Descriptive statistics can highlight relationships between data sets with multiple variables.
- Inferential statistics make and test theories about a data set. It aims to evaluate whether the observations made about a sample apply to the underlying population.
What is the relationship between descriptive and inferential statistics?
There is no direct relationship between descriptive and inferential statistics, as their purposes are very different. Many descriptive statistics such as the mean and the variance are used in the tests performed in inferential statistics.
What is the purpose of descriptive statistics?
As per the definition of descriptive statistics, the purpose of descriptive statistics is to describe and summarize a data set. Using descriptive statistics to analyze a data set is crucial in understanding it.
How do I do descriptive statistics in Excel?
Microsoft Excel has built-in descriptive statistics functionality. Here's how to use it:
- In the "Data" tab, select the "Data Analysis" command.
- Select and confirm the "Descriptive Statistics" option in the list.
- Follow the prompts to create a full descriptive statistics table for your Excel data.