Welcome to the 5 number summary calculator, where you'll have the chance to learn the theory and practice of how to find the 5 number summary of your dataset. Whenever we're analyzing a large (but finite) set of data and want to know how its elements are distributed, this is the tool that we turn to first. The five number summary in statistics gives you much more information than, for example, the average. What is more, it allows you to present that data in the form of a neat chart (and, don't you worry, we'll explain this so-called box and whisker plot too).
So, what exactly is a 5 number summary? Well, why don't we grab a cup of hot chocolate for the journey and find out!
What is a 5 number summary?
Since the COVID-19 pandemic began, a lot has changed on the job market, and the unemployment rate has gone up a lot.
Say that you're looking for work, but during interviews your prospective employers are very hesitant to tell you what your salary would be. Instead, they choose to tell you what the mean among their workers' income is. How does that help, and how far is it from what you will be earning?
Suppose, for instance, that a company hires thirty people and says that their average salary is $4,000 per month. Not too bad, is it? But then it turns out that your first check would be for $1,500. How can it be so far from the $4,000 you heard? Is it because of taxes or what? It was the average, after all.
The thing is that people in high places make a lot more than the bottom-line workers. If the CEO makes, say, $30,000 for sitting at their desk, their two closest colleagues make $15,000, and the secretary gets $7,000 for making coffee, then they greatly increase the average salary of the company. Even if many employees make $1,500, the top values still boost the mean so much that they can truthfully boast about the average being $4,000.
So what is a 5 number summary? It is a tool to deal with such discrepancies. It consists of five numbers (now, that was a surprise, wasn't it?), which are quite different from the mean of your dataset. Rather than that, they tell you (roughly) how the numbers are distributed between the minimal value and the maximal. They are (from smallest to largest):
- Minimum: The smallest number in the dataset;
- First quartile: The middle of the smaller half;
- Median: The middle of all the values;
- Third quartile: The middle of the larger half; and
- Maximum: The largest number in the dataset.
For instance, the five number summary on the statistics from the above example would tell you that there are only a few people that come close to the maximal salary of $30,000, but plenty of employees making $1,500.
The cool thing is that there's also a nice way to visualize the 5 number summary: the so-called box and whisker plot. Oddly enough, it has nothing to do with a cat's whiskers. Let's jump to the next section and see what it's all about.
🔎 Hungry for more knowledge? Or not sure about any of the notions we've evoked? Here are some Omni tools that will help you:
Formulas of 5 number summary
In this section, we present the formulas you need to use to find each of the 5 number summaries for your dataset.
-
For minimum and maximum values: Arrange the dataset in ascending or descending order. In ascending order, the first term is the minimum, and the last term is the maximum. In descending order, the first term is the maximum, and the last term is the minimum.
-
For the first quartile: Take the arranged dataset's lower half and calculate the first half's median. The first quartile is of the dataset. The formula of the first quartile is:
- For median: If the total terms of the data set are odd, then the formula for the median is:
And, if the total terms of the data set are even, the formula for the median is:
- For the third quartile: You just need to take the upper half of the arranged dataset and calculate the median of the upper half. The third quartile is of the dataset. The formula of the third quartile is:
Box and whisker plot explained
Let's once again study the example from the above section: the salaries in a company offering you a job. Say that you somehow got your hands on the five number summary statistics of these values in the form of a box and whisker plot:
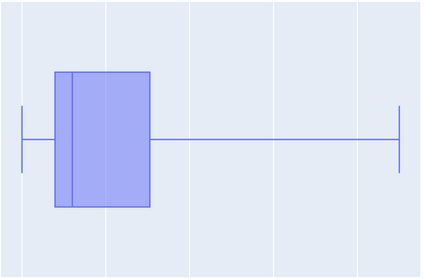
Even though we don't have a scale on the horizontal axis, we can still get a lot of useful information from the picture. But first, let's explain all the elements of the box and whisker plot.
Firstly, let's see how to find the 5 number summary on this plot. In fact, this couldn't be simpler: the five values (from smallest to largest, as given in the above section) are drawn as the vertical lines on the plot (from left to right), i.e.,
- The minimum is the left end of the left horizontal line (whisker);
- The first quartile, the median, and the third quartile are the three consecutive lines of the rectangle (box): its left side, the line through the middle, and the right side; and
- The maximum is the right end of the right horizontal line (whisker).
Therefore, even without the numbers that correspond to these lines, we can observe quite a few things here.
- The maximum value is much larger than most of the values. This means that the CEO makes a lot more than the average employee.
- Even though the minimal number is some distance away from the median, there can't be too many people earning that amount. After all, from there to the first quartile, we represent only a quarter of all the values. This shows that although the starting salary may be low, getting a raise seems highly probable.
- The box represents values between the first and the third quartile, which correspond to half of the entries. This gives a rough idea of where the average salary lies (somewhere around the box) and how far it is from the minimum (the starting salary).
Remember, however, that the 5 number summary in statistics provides only a general idea of your dataset, so this data analysis is not as exact as we'd sometimes wish. Still, now that we have the box and whisker plot explained, we can make good use of this information, however rough it is.
We've seen one side of the problem, let's now check out the other one. It's high time we see how to find the 5 number summary of an arbitrary dataset.
How to find the 5 number summary
Say that you're given a sequence of numbers, a₁, a₂, a₃,..., an, and, for simplicity, assume that they are ordered from the smallest to the largest (otherwise, we'd have to order them before moving to the next step).
We begin the process of how to find the 5 number summary of our sequence from the simplest of the five values:
minimum = a₁; and
maximum = an.
A keen eye will observe that here it is crucial that our sequence is ordered. If it weren't, the indices 1 and n could be wrong.
Next, we find the median. By definition, it is the "middle" value of our sequence. This means that if, for instance, we have seven numbers (i.e., n = 7), then the median will be equal to a₄ because this entry has three elements to the left (smaller) and three elements to the right (larger).
"But what if n is even? There is no middle, then, is there?" In that case we have to create the middle ourselves: we take the two numbers that are closest to the center (e.g., for n = 8, they would be a₄, and a₅) and take their average, i.e., sum them and divide the result by two (for n = 8, it would be median = (a₄ + a₅) / 2).
Now that we've explained how to find the median, it's easiest to define the first and third quartiles like this: they are the medians of the first and the second half of all the entries, respectively. Note that the name quartile comes from the fact that they define the end of the first quarter and the beginning of the last quarter of entries, respectively. Equivalently, we can say that 25% (a quarter) of all values are below the first quartile and that 75% (three quarters) are below the third quartile. This, in turn, means that they correspond to the 25th and the 75th percentile of the dataset.
For instance, if n = 8, then the first quartile is the median of entries a₁, a₂, a₃, a₄, and the third quartile is that of entries a₅, a₆, a₇, a₈. However, if n is odd, say, n = 7, then they are the medians of a₁, a₂, a₃, a₄ and of a₄, a₅, a₆, a₇, respectively (i.e., the middle number is repeated in both sequences).
So what is a 5 number summary? It is simply the set of these five numbers:
- Minimum;
- First quartile;
- Median;
- Third quartile; and
- Maximum.
Phew, a lot of time has passed since we began reading through all this theory. It wouldn't hurt to see some numeric example, would it? In a second, we'll do just that and finally see the 5 number summary calculator in action!
Example: using the 5 number summary calculator
Say that you're a high school teacher and that you're marking a recent test you gave your students. You're not too sure if you made it too easy or too difficult. Let's analyze the results using our 5 number summary calculator to find out, shall we?
The test was out of 50 points, and the results are:
32, 21, 38, 12, 44, 42, 37, 36, 21, 9, 40, 33, 22, 25, 27, 29, 30, 48, 19, 17, 30, 22, 45, 42.
There are twenty-four tests, and at first glance, it's very difficult to see if, generally speaking, it went well or not. Fortunately, the 5-number summary calculator will give us some insight into the answer, so let's see what we get.
All we need to do is input the entries one by one. Observe that when we open the 5-number summary calculator, we see only eight fields where we can input numbers. However, once we fill these in, new ones will appear, and, all in all, the calculator allows up to thirty values.
We write our numbers in the fields marked as #1 up to #24. Observe how a partial answer is already shown when we input the second value and how it changes with every number we give. Also, note how our entries are not ordered from smallest to largest. The calculator does the ordering for us and even gives us the tidied sequence under the variable fields.
Once we input the last number, we'll see the five-number summary of our statistics problem. Before we analyze it, let's grab a piece of paper and see how to find the 5-number summary ourselves.
First of all, we need to order our numbers from smallest to largest. Oh, bother... That's already some overtime in comparison to using the Omni Calculator. Anyway, here it is:
9, 12, 17, 19, 21, 21, 22, 22, 25, 27, 29, 30, 30, 32, 33, 36, 37, 38, 40, 42, 42, 44, 45, 48.
Just as we described in the above section, we begin by finding the minimum and the maximum:
minimum = 9,
maximum = 48.
Well, no one got zero, so that's a good thing. But no one got the maximum, either. Anyway, let's leave the analysis for later and get back to the other three values from the five-number summary.
Now, we calculate the median of our dataset. Since we have 24 entries (which is an even number), we'll need to find the average of two middle entries. Since 24 / 2 = 12, they'll be the 12th and the 13th. We look back at our ordered sequence, count through the values, and see that they are 30 and 30. Well, that makes the calculation a piece of cake:
median = (30 + 30) / 2 = 30.
Lastly, we need the first and third quartiles. We know that they are, respectively, the medians of the first and the second half of the entries, which, in our case, are the first 12 and the last 12 values. Again, 12 is an even number, which means that here we'll also have to find the average of two numbers.
Since 12 / 2 = 6, the first quartile will be the mean of the 6th and the 7th number, i.e., of 21 and 22. Similarly, the third quartile will need the 18th and the 19th (since 12 + 6 = 18), which are 38 and 40. This gives
1st_quartile = (21 + 22) / 2 = 21.5,
3rd_quartile = (38 + 40) / 2 = 39.
So what is the 5-number summary of our sequence? It's given by
- Minimum:
9; - First quartile:
21.5; - Median:
30; - Third quartile:
39; and - Maximum:
48.
This seems like quite a good distribution if you ask us. Let's also check how it looks on the box and whisker plot:
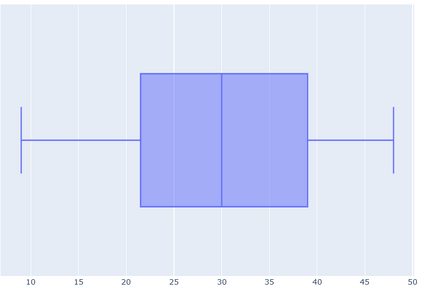
Certainly, most students scored slightly above the middle value of 25 points. This suggests that the students didn't just flip a coin before choosing the answer. Also, the median is at 30, so more than half of them passed.
This data analysis will be useful when we have to prepare the next test. But that will be the last one this school year, so maybe we should make it slightly easier? After all, most probably, they're already thinking about how they'll go to the beach once it's all over. And who are we to blame them? We could use a nap ourselves...