This skewness and kurtosis calculator is a statistical tool for the advanced analysis of datasets. Thanks to our calculator, you will quickly test your dataset for normality and immediately identify any skew in the results. We also explain how to calculate skewness using skewness formulas, should you ever need to find them by hand.
The very first step in analyzing your distribution is taking a look at its basic numerical summary. Check out our descriptive statistics calculator if you haven't done so yet!
What are skewness and kurtosis?
You are probably familiar with the normal distribution (if not, we have a normal distribution caculator😉). When we draw it, it looks like a bell (or like a boa constrictor digesting an elephant... more or less). It's a continuous data distribution, symmetric about the central value. There is no bias to the left or right.
Such a distribution describes many observations we make in nature. For example, given a sufficiently large group of students, you will find that their test results more or less follow the shape of a normal distribution. You will find the same trend when analyzing the shoe sizes of adults.
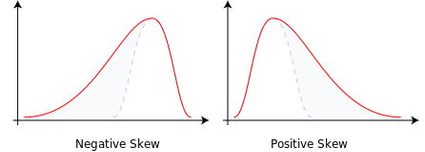
Sometimes, though, the distribution doesn't look as ideal as in the handbooks. It may seem a bit skewed, with a tendency to the left or the right. We use the coefficient of skewness to measure this asymmetry of the distribution.
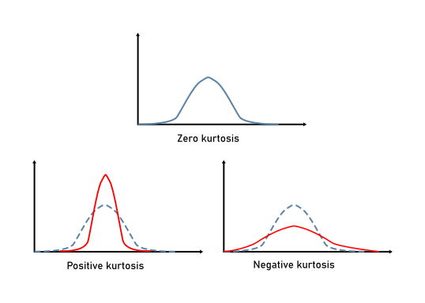
It may also occur that the data points cluster in one specific region of the probability density curve – for example, around the center value or one of the tails. We use the coefficient of kurtosis to measure the "tailedness" of the distribution. Kurtosis ignores the central values, so it only analyzes what the tails of the distribution look like.
Skewness formula
You can find many different skewness formulas, each with a slightly different interpretation. The same holds for kurtosis formulas. So, how to calculate skewness? In this skewness calculator, we apply the same equations that are used in Microsoft Excel for the analysis of a data sample.
The skewness formula is as follows:
skewness = Σ(xn − x̄)³ × N / [(N − 2) × (N − 1) × s³]
where:
- xn — Individual data points, with indices n = 1, 2, 3, ... , N;
- x̄ — Mean of the data sample;
- s — Standard deviation of the data sample; and
- N — Number of observations.
As you can see, for the denominator of this formula to not be equal to zero, you need at least three observations in the data sample.
Kurtosis formula
The kurtosis formula we use in this skewness calculator is also consistent with Microsoft Excel:
kurtosis = Σ(xn − x̄)⁴ × N × (N + 1) / [(N − 1) × (N − 2) × (N − 3)× s⁴] − 3 × (N − 1)² / [(N − 2) × (N − 3)]
You can find the same notation here as in the skewness formula:
- xn — Individual data points, with indices n = 1, 2, 3, ... , N;
- x̄ — Mean of the data sample (how to calculate mean);
- s — Standard deviation of the data sample; and
- N — Number of observations.
For the denominator of this formula to not be equal to zero, you need at least four observations in the data sample.
How to interpret the coefficient of skewness?
Once you know what the skewness and kurtosis of a given data sample are, you need to interpret this value in a certain way. There are a few general rules you can use:
-
A negative value of skewness implies a skew to the left. It means that the left tail of the probability density graph is longer than the right one;
-
A positive value of skewness implies a skew to the right. The right tail of the probability density graph is longer than the left one;
-
Skewness = 0 means that the data is symmetrical, with no bias to left or right;
-
We can describe distributions with a skewness between -0.5 and 0.5 as approximately symmetric;
-
We can describe distributions with a skewness between -1 and -0.5 and 0.5 and 1 as moderately skewed; and
-
We can describe distributions with a skewness lower than -1 or higher than 1 as substantially skewed.
Meaning and interpretation of kurtosis
A perfect normal distribution has a kurtosis coefficient equal to zero. However, you will rarely encounter such an ideal case. Still, there are still some rules of thumb that you can apply when interpreting this coefficient!
-
A positive value of kurtosis means that your dataset is more "peak-heavy" (more peaked) than the normal distribution;
-
A negative value of kurtosis means that your dataset is less "tail-heavy" (flatter) than the normal distribution;
-
We consider distributions with kurtosis greater than 1 as too peaked; and
-
We consider distributions with kurtosis lower than -1 too flat.
How to calculate skewness: an example using the skewness calculator
Let's find out what is the skewness and kurtosis of a data sample representing the height of children in 6th grade.
-
We will assume we measured the height of 18 boys, all in the same class. We got the following values: 140, 146, 146, 148, 152, 153, 154, 156, 156, 160, 162, 162, 163, 165, 166, 166, 168, 172. We measured all of these values in centimeters.
-
We already know the number of observations, so we can note that N = 18.
-
The next step is to calculate the average height among these boys. We sum up all values and divide that sum by 18, obtaining x̄ = 157.5.
-
We also need to find the standard deviation of this sample. Luckily, the skewness calculator finds this value by itself – it is equal to s = 8.833.
-
In the last step, we input these intermediate results into the skewness and kurtosis formulas. We obtain the following values:
skewness = -0.3212
kurtosis = -0.7195
The negative value of the coefficient of skewness implies a slight skew to the left. It means that there are more short boys than tall boys in this group. Skewness is close to zero, so the distribution is relatively symmetric.
Kurtosis is negative, which means the distribution is quite flat – there is no strong peak in the middle. The absolute value of kurtosis is high, suggesting that the height is more or less uniform in this class.
🙋 Eager to learn more about statistics? Make sure to visit the following Omni calculators: