The mean median mode calculator is the easiest tool to help you to learn about the measures of central tendency.
Keep reading to learn:
- The definitions of mean, median, and mode;
- How to find the mean, median, mode, range, and midrange;
- The formulas for mean, median, mode, range, and midrange;
- And more.
This calculator will not only tell you the answer but also show you all the steps to calculate the mean, median, mode, range, and midrange manually. There is even a section dedicated to real-life applications of mean, mode, and median!
What is mean, median, and mode?
The mean, median, and mode are three of the most common measures of the center of a distribution (whether it's a binomial distribution, Poisson distribution or any other distribution), also called the central tendency.
Mean, median, and mode definitions:
-
The mean is the average of all numbers.
-
The median is the "middle" number, where there is an equal number of values less than and greater than the median.
-
The mode is the most frequently occurring number.
What is range and midrange?
The range (a measure of spread) and midrange (another measure of central tendency) are also commonly used to describe a set of numbers.
Definition of range and midrange:
-
The range is the difference between the minimum and maximum values.
-
The midrange is the value exactly halfway between the minimum and maximum values.
Detailed definitions and formulas for mean, median, mode, range, and midrange are described below. Are you curious specifically about how to find the range with the range formula? Check out this section of the mean median mode calculator.
How to find the mean – Average formula
When people talk about the mean, they are usually referring to the arithmetic mean, which is the average of all numbers in the dataset. Are you asking yourself, "How to find the mean?" Here is your solution:
The formula for the arithmetic mean is:
μ = ∑X / N
where:
- μ represents the population mean (you can use the letter M to represent the mean of a sample instead, but the calculation is the same);
- ∑X represents the sum of all numbers; and
- N is the total number of numbers.
For example, you would calculate the mean for the numbers 2, 5, 6, 8, 9 as follows:
μ = (2 + 5 + 6 + 8 + 9) / 5
μ = 30 / 5
μ = 6
Try it yourself!
Enter your numbers into the mean, median, and mode calculator and select mean in the explore calculations dropdown menu to see the calculation steps for the mean.
You might also be interested in knowing that the mean plays an important role in calculating the dispersion of data. Go to the variance calculator to discover the most popular measure of dispersion.
Median definition
The median is defined as the "middle" number in a sorted list of numbers. There is an equal number of numbers above and below the median.
When determining how to calculate the median, we need to know if the dataset is even or odd:
-
If there is an odd number of numbers, such as the dataset 4, 6, 9, the median is simply the middle number, in this case, 6.
-
If there is an even number of numbers, such as the dataset 3, 6, 7, 9, the median is the average of the two middlemost numbers, in this case, 6 and 7, so the median is 6.5.
How to find the median
As an example of how to find the median, let's find the median of the set of numbers 2, 7, 4, 8, 6, 9:
1. Sort the numbers from the lowest to the highest
The list is:
2, 4, 6, 7, 8, 9
Note that sorting from the lowest to the highest is also acceptable.
2. Determine the "center" of the numbers
You can probably see at a glance that the middle two numbers are 6 and 7, but, in a large dataset, it will help to know how many numbers are in the set.
To find out the "center" of the dataset, use the equation:
Center = (N + 1) / 2
Since there are six numbers, the center is calculated as follows:
Center = (6 + 1) / 2 = 3.5
Since the "middle" number is 3.5, the median will be the average of the 3rd and 4th numbers in our list.
3. Find the median
Counting from left to right (or right to left), we find that the 3rd and 4th numbers are 6 and 7:
2, 4, 6, 7, 8, 9
The median is the average of 6 and 7. Therefore, the median is 6.5.
Mode definition
The mode is the number that occurs most frequently. There can be a few scenarios:
-
If one number occurs more frequency than all the others, there is one mode, and the distribution is called unimodal.
-
If more than one number occurs at the highest frequency, then there are multiple modes, and the distribution is called multimodal.
-
If there are exactly two modes, the distribution is still multimodal, but to be more specific, you can call it bimodal.
- If all numbers occur the same number of times (e.g., each number appears once), then there is no mode.
How to find the mode
Here is a practical example of how to find the mode. Let's use three methods to find the mode of this list of numbers: 2, 7, 6, 4, 7, 7, 6, 8, 7, 4, 6
Method 1. Tick marks on a number line
One easy way to find the mode with pen and paper is to create a number line and add a tick mark or a dot on the number line for each number:
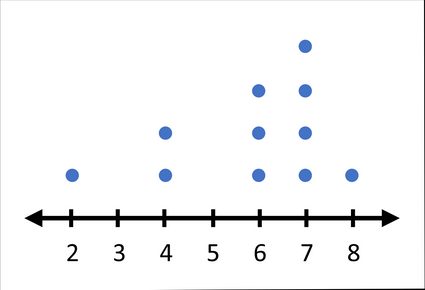
The number 7 has the highest column and is therefore the mode.
Method 2. Arrange the numbers from least to greatest
Sorting makes it easier to see the mode visually:
2, 4, 4, 6, 6, 6, 7, 7, 7, 7, 8
Note how many times each number occurs. The number 7 occurs most frequently, four times in total.
Method 3. Create a frequency table
Finally, it can be useful to organize the data in a frequency table for large datasets. You can fill in the frequency table after sorting the numbers from least to greatest:
Value | Number of Occurences |
|---|---|
2 | 1 |
4 | 2 |
6 | 3 |
7 | 4 |
8 | 1 |
You can also visualize the data using a stem-and-leaf plot to determine the range in which most of your values lie.
How to calculate range and midrange – Range formula
The range is the simplest measure of spread (how varied a set of numbers is). To find the range, calculate the difference between the maximum and minimum values using the range formula:
Range = max - min
The midrange is yet another measure of the central tendency, like the mean, median, and mode. The midrange is exactly halfway between the maximum and minimum values. In other words, it is the average of the maximum and minimum values:
Midrange = (max + min) / 2
For the set of numbers 2, 7, 6, 4, 7, 7, 6, 8, 7, 4, 6, the minimum is 2 and the maximum is 8. Therefore, the range is 8 - 2 = 6 and the midrange is (8 + 2) / 2 = 5.
How to use the mean mode and median calculator
Follow these simple steps to find the mean, mode, and median with this calculator:
- Insert the numbers separately into the calculator. You can insert up to 30 values.
- Select the result you want to investigate in detail, including calculation steps. You can look at one specific measure: mean, mode, median, range, or midrange.
- That's it! The calculator automatically shows the summary of your dataset, which includes all measures of the central tendency and range.
Applications of mean, median, and mode
The concepts of mean, median, and mode aren't just theoretical, but they’re also widely used in real-world problem solving across industries. Each measure provides unique insights depending on the context and data type. Here are some real-life applications of mean, median, and mode:
Field | Mean | Median | Mode |
|---|---|---|---|
Sports | Average points, assists, or times to evaluate performance | Median time or score to reduce the effect of outlier games | Most frequent score or event (e.g., goals per match) |
Business | Average sales or profit margins | Median income to analyze economic inequality | Most sold product or most common customer feedback |
Healthcare | Mean dosage or treatment duration | Median survival time to avoid outlier effects | Most common diagnosis or symptom |
Education | Average test scores across students | Median grades to assess performance fairly | Most common answer or grade |
Public policy | Mean household size or spending | Median age or income for policy planning | Most frequent demographic feature |
FAQs
How do I find the mean?
To find the mean, add all values (xₙ) together and divide by the number of values (n). The formula used to find the mean is:
Mean = (x₁ + x₂ + ... + xₙ) / n
Here is an example of how to find the mean for (2, 4, 6):
Mean = (2 + 4 + 6) / 3 = 4
How do I find the mode?
The mode is the number with the highest frequency, hence, count how many times each number occur to find the mode. Some datasets can have one, multiple or no mode at all.
Here are some examples:
- Unimodal mode: In (3, 4, 4, 6, 7), 4 appears twice, so the mode is 4.
- Multimodal mode: In (2, 2, 3, 3, 4), both 2 and 3 appear twice, so the modes are 2 and 3.
- No mode available: In (1, 2, 3, 4, 5), all values appear once, so there is no mode.
How do I calculate median?
To find the median of a dataset, first arrange the data in numerical order. If there’s an odd number of values, the median is the one in the center. If there’s an even number of values, the median is the average of the two middle values. Here is an example of how to find the median:
- Odd count: In (3, 5, 7), the median is 5 since it is the middle value.
- Even count: In (2, 4, 6, 8), the median is (4 + 6) / 2 = 5.
Which central tendency is affected by extreme values?
The mean is the central tendency measure which is most sensitive to outliers. An extremely high or low number in the dataset can pull it away from the typical value. The median is more robust and often better for skewed data.
For instance, the mean of the dataset (10, 12, 13, 100) is 33.75, but the median is 12.5. The mean is pulled up by 100, which is a much higher value comapred to the other three.
How do I calculate mean, mode and median in Excel?
To calculate the mean, mode and median in Excel, use the functions AVERAGE(), MODE.SNGL() and MEDIAN.SNGL(). Let's say the data is in the range of A1:A10, follow these simple steps:
- Select the cell for the mean output, insert = AVERAGE(A1:A10) and press enter.
- Select the cell for the mode output, insert = MODE.SNGL(A1:A10) and press enter.
- Select the cell for the median output, insert = MEDIAN.SNGL(A1:A10) and press enter.
- That's it! You have found mean, mode and median in Excel.