Our exponential regression calculator is here for you whenever you need to determine the exponential regression model of a data set, i.e., in other words, to find the exponential curve of best fit.
What is exponential regression? Keep reading as we not only provide you with the exponential regression formula but also explain how to calculate exponential regression and explain in what situations the exponential fit proves useful. As a bonus, we show you how to derive the exponential regression equation so that you don't need to learn it by heart. 😉
What is the exponential regression?
The aim of exponential regression is to find an exponential curve that best fits a given set of data points. This is very similar to other regression models, which you can discover via Omni tools:
- Linear regression calculator, where we look for the (straight) line of best fit;
- Quadratic regression calculator, which is all about fitting a parabola;
- Cubic regression calculator deals with best-fitting cubic (i.e., degree three) curves; and
- Polynomial regression calculator, where we look for the best-fitting polynomial curve.
There are lots of situations where the data follows neither a straight line nor a parabola, but an exponential curve seems to be just right; these are processes that grow slowly in the beginning and then accelerate rapidly or whose decay begins rapidly and then slows down as time passes. Examples include investment growth, temperatures of cooling objects, and radioactive decay.
Exponential regression model
Let x be the explanatory variable and y the response variable. The exponential regression equation reads y = a × bx, where a ≠ 0 and b > 0, b ≠ 1. The coefficients a and b must be so chosen that the equation corresponds to the exponential curve of best fit for the dataset, (x1, y1), ..., (xn, yn):
In the next section, we will tell you how to find the coefficients a and b. Let's discuss their meaning here:
- a is the value predicted by the exponential regression model for x = 0;
- If b > 1, the exponential fit describes an exponential growth; and
- If 0 < b < 1, the exponential fit describes an exponential decay.
Note that we have a × bx+1 = a × b × bx, so if x increases by 1 unit, then y is multiplied by b. This is in stark contrast to the linear regression y = m × x + c, where an increase in x of 1 unit results in the value of m (slope) being added to y!
How to calculate the exponential regression formula?
We've discussed the equation for exponential fit, but how to calculate exponential regression once we have collected some data? The trick is to:
- Transform our data so that it allows a linear model.
- Determine that linear model, e.g., with the method of least squares.
- Transform the data along with the model back to the original form.
Exponential regression formula for the data (x, y) is:
y = exp(c) × exp(m × x)
where m is the slope and c is the intercept of the linear regression model fitted to the data (x, ln(y)). See the next section to check the details of the derivation.
Exponential regression equation: derivation
With the exponential regression model, we strive to explain our data with the help of the equation in the form y = a × bˣ. Here, we show you how the exponential regression formula can be derived. To determine the coefficients a and b, follow these steps:
-
Take the logarithm of both sides of the equation; we have the following equivalent equation:
ln(y) = ln(a × bx)
-
The properties of logarithms give:
ln(y) = ln(a) + ln(bx)
and
ln(y) = ln(a) + x × ln(b)
-
We have expressed ln(y) as a linear function of x, with slope ln(b) and intercept ln(a).
-
Find the best-fit line for (x, ln(y)). Let's say it reads ln(y) = c + x × m.
-
Look for the a and b which satisfy
ln(a) = c and ln(b) = m
-
To calculate a and b, take the exponent (antilogarithm) of the slope m and intercept c:
a = exp(c) and b = exp(m)
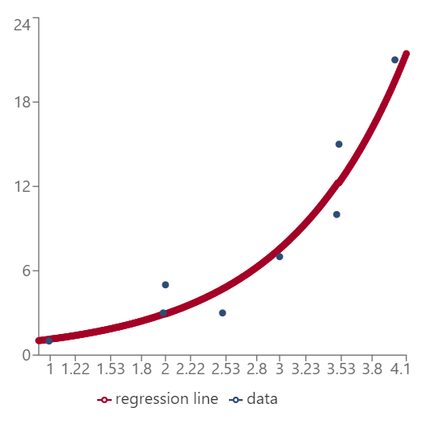
How to use this exponential regression calculator
-
Enter your data into the calculator. You can input up to 30 data points (new rows will appear as you fill out the fields). Remember that we need at least 3 points (both coordinates!) to fit a model.
-
A scatter plot with your data appears along with the exponential curve of best fit.
-
Above the graph, you can find the exponential regression equation for your data.
-
If need be, change the precision (number of significant figures) with which the coefficient is computed. The default precision is set to 4 sig figs.
FAQs
What is the formula for the exponential function?
The formula for the exponential function is f(x) = a × bx or f(x) = abx, where a is the coefficient, b is the base number, and x is the exponent. This applies when a ≠ 0 and b > 0, b ≠ 1.
How do I calculate exponential regression?
To calculate exponential regression, you need to:
- Transform your data so that it allows a linear model.
- Determine the specific linear model by using the method of least squares.
- Transform the data and the model back to the original form.
What does R-squared mean in exponential regression?
R² is the coefficient of determination in exponential regression. In other words, the value of R² indicates how accurate your regression line represents your data points. The closer R² is to 1, the more accurate the regression is.
What is the difference between linear regression and exponential regression?
The rate of change for y based on x are different. In linear regression, the change of y is a constant addition, while in exponential regression, the change of y is a constant multiplication.
For example, the value of y could increase by +3 in linear regression or ×3 in exponential regression, as shown in the table:
Linear regression | Exponential regression |
|---|---|
1 | 1 |
4 | 3 |
7 | 9 |
10 | 27 |
13 | 81 |
How do I do an exponential regression on Desmos?
To use Desmos to plot an exponential regression:
- Input your data points (x1 and y1, etc.) by inserting them in a table, or pasting them from Excel.
- Your data plots will appear on your Desmos graph.
- Insert your exponential equation or model into the next cell to create an exponential regression line in your graph.
- You've nailed it!