This confidence interval calculator is a tool that will help you find the confidence interval for a sample. You can use it with any arbitrary confidence level. If you want to know what exactly the confidence interval is and how to calculate it, or if you are looking for the 95% confidence interval formula for z-score, this article is bound to help you.
📊 Your Real-World Statistics Resource Hub
Discover our full that includes expert articles and reports — all in one place!
Popular reads:
What is the confidence interval?
The definition says that, "a confidence interval is the range of values, derived from sample statistics, that is likely to contain the value of an unknown population parameter." But what does that mean in reality?
Imagine that a brick maker is concerned about whether the mass of bricks he manufactures is in line with specifications. He has measured the average mass of a sample of 100 bricks to be equal to 3 kg. He has also found the 95% confidence interval to be between 2.85 kg and 3.15 kg. It means that he can be 95% sure that the average mass of all the bricks he manufactures will lie between 2.85 kg and 3.15 kg. More precisely, if the brick maker took lots of samples of 100 bricks and used each sample to compute the confidence interval, then 95% of these intervals would contain the true average mass of a brick.
Of course, you don't always want to be exactly 95% sure. You might want to be 99% certain, or maybe it is enough for you that the confidence interval is correct in 90% of cases. This percentage is called the confidence level. If you'd like to know more about interpreting confidence correctly, take a look at our detailed article: How to Interpret Confidence Interval: A Complete Guide.
How to use the confidence interval calculator
Finding the confidence interval using our calculator is very easy. Just follow the given steps:
- Choose whether you want to consider a confidence interval for the population mean or the population proportion.
- In the former case, select whether you know the standard deviation or the standard error.
- Enter the mean of your sample.
- Input the standard error or standard deviation and sample size based on the selection in the second point. You can use our standard deviation calculator if needed.
- Choose your desired confidence level.
- In case of the confidence interval for the population proportion, you need to provide the sample proportion and sample size instead.
That's it. The calculator will display the margin of error and the upper and lower bounds of the confidence interval. Still not sure about the difference between confidence interval and standard deviation? Check out our practical guide on Confidence Interval vs. Standard Deviation.
95% confidence interval formula
Calculating the confidence interval requires you to know three parameters of your sample: the mean value, μ, the standard deviation, σ, and the sample size, n (number of measurements taken). Then you can calculate the standard error and then the margin of error according to the following formulas:
standard error = σ/√n
margin of error = standard error * Z(0.95)
where Z(0.95) is the z-score corresponding to the confidence level of 95%. If you are using a different confidence level, you need to calculate the appropriate z-score instead of this value. But don't fret, our z-score calculator will make this easy for you!
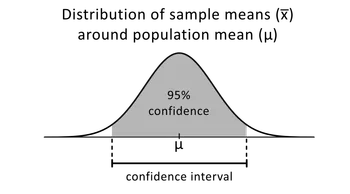
How to find the Z(0.95) value? It is the value of z-score where the two-tailed confidence level is equal to 95%. It means that if you draw a normal distribution curve, the area between the two z-scores will be equal to 0.95 (out of 1).
If you want to calculate this value using a z-score table, this is what you need to do:
- Decide on your confidence level. Let's assume it is 95%.
- Calculate what is the probability that your result won't be in the confidence interval. This value is equal to 100%–95% = 5%.
- Take a look at the normal distribution curve. 95% is the area in the middle. That means that the area to the left of the opposite of your z-score is equal to 0.025 (2.5%) and the area to the right of your z-score is also equal to 0.025 (2.5%).
- The area to the right of your z-score is exactly the same as the p-value of your z-score. You can use the z-score tables to find the z-score that corresponds to 0.025 p-value. In this case, it is 1.959.
Once you have calculated the Z(0.95) value, you can simply input this value into the equation above to get the margin of error. Now, the only thing left to do is to find the lower and upper bound of the confidence interval:
lower bound = mean - margin of error
upper bound = mean + margin of error
How to calculate confidence interval?
To calculate a confidence interval (two-sided), you need to follow these steps:
- Let's say the sample size is
100. - Find the mean value of your sample. Assume it's
3. - Determine the standard deviation of the sample. Let's say it's
0.5. - Choose the confidence level. The most common confidence level is
95%. - In the statistical table find the Z(0.95)-score, i.e., the 97.5th quantile of N(0,1) – in our case, it's
1.959. - Compute the standard error as
σ/√n = 0.5/√100 = 0.05. - Multiply this value by the z-score to obtain the margin of error:
0.05 × 1.959 = 0.098. - Add and subtract the margin of error from the mean value to obtain the confidence interval. In our case, the confidence interval is between 2.902 and 3.098.
That's it! That was quite of a lot of computations, wasn't it? Luckily, our confidence level calculator can perform all of these calculations on its own.
How to calculate confidence interval using a dataset?
Now, let us see the determination of the confidence interval from a dataset in detail. Suppose the following data:
21, 13, 11, 14, 52, 23, 12, 11, 50, 55, 0, 1, 1, 7, 33, 51, 41, 44, 47, 9, 19, 10, 20, 30, 26, 38, 41, 5, 40, 2, 39, 42, 55, 22, 48, 50
What is the 99 percent confidence interval?
To answer this question, let us first count the total amount of values to establish the sample size: . Now, we can find the sample mean:
The next step is determining the standard deviation, whose value will be . Therefore, we can obtain the following standard error: .
The previous results enable us to find the margin of error: . Thus, the lower and the upper bound values are:
Therefore, the 99 percent confidence interval is . You can check these results with our confidence interval calculator in the blink of an eye.
Confidence interval application in time series analysis
One peculiar way of making use of confidence interval is the time series analysis, where the sample data set represents a sequence of observations in a specific time frame.
A frequent subject of such a study is whether a change in one variable affects another variable in question.
To be more specific, let's consider the following general question that often raises economists' interest: "How does a change in the interest rate affect the price level?"
There are several ways to approach this issue, which involves complex theoretical and empirical analysis, that is far beyond the scope of this text. Besides, there are multiple techniques to estimate and apply confident intervals, but still, through this example, we can represent the functionality of confidence interval in a more complicated problem.
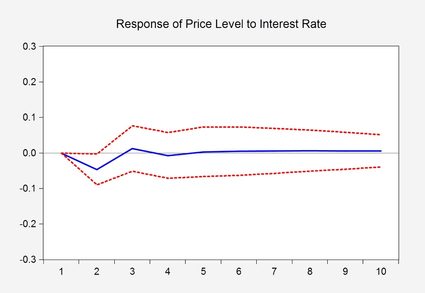
The above graph is a visual representation of an estimation output of an econometric model, a so-called Impulse Response Function, that shows a reaction of a variable at the event of a change in the other variable. The red dashed lines below and above the blue line represent a 95% confidence interval, or in another name, confidence band, which defines a region of most probable results. More specifically, it shows that after a change in interest rate, it is only the second month when a significant response occurs at the price level.
To sum up, we hope that with the above examples and short description, you get more insight into the purpose of the confidence interval, and you gain the confidence to use our confidence interval calculator.
FAQs
How to interpret confidence intervals?
If you repeatedly draw samples and use each of them to find a bunch of 95% confidence intervals for the population mean, then the true population mean will be contained in about 95% of these confidence intervals. The remaining 5% of intervals will not contain the true population mean.
What is the z-score for 95% confidence interval?
The z-score for a two-sided 95% confidence interval is 1.959, which is the 97.5-th quantile of the standard normal distribution N(0,1).
What is the z-score for 99% confidence interval?
The z-score for a two-sided 99% confidence interval is 2.807, which is the 99.5-th quantile of the standard normal distribution N(0,1).
What will increase the width of a confidence interval?
The width of a confidence interval increases when the margin of error increases, which happens when the:
- Significance level increases;
- Sample size decreases; or
- Sample variance increases.
What will decrease the width of a confidence interval?
The width of a confidence interval decreases when the margin of error decreases, which happens when the:
- Significance level decreases;
- Sample size increases; or
- Sample variance decreases.
The sample mean has no impact on the width of a confidence interval!