Mapped: 17 States Where Seniors Now Outnumber Kids
Want more stories like this?
Follow Omni on Google.


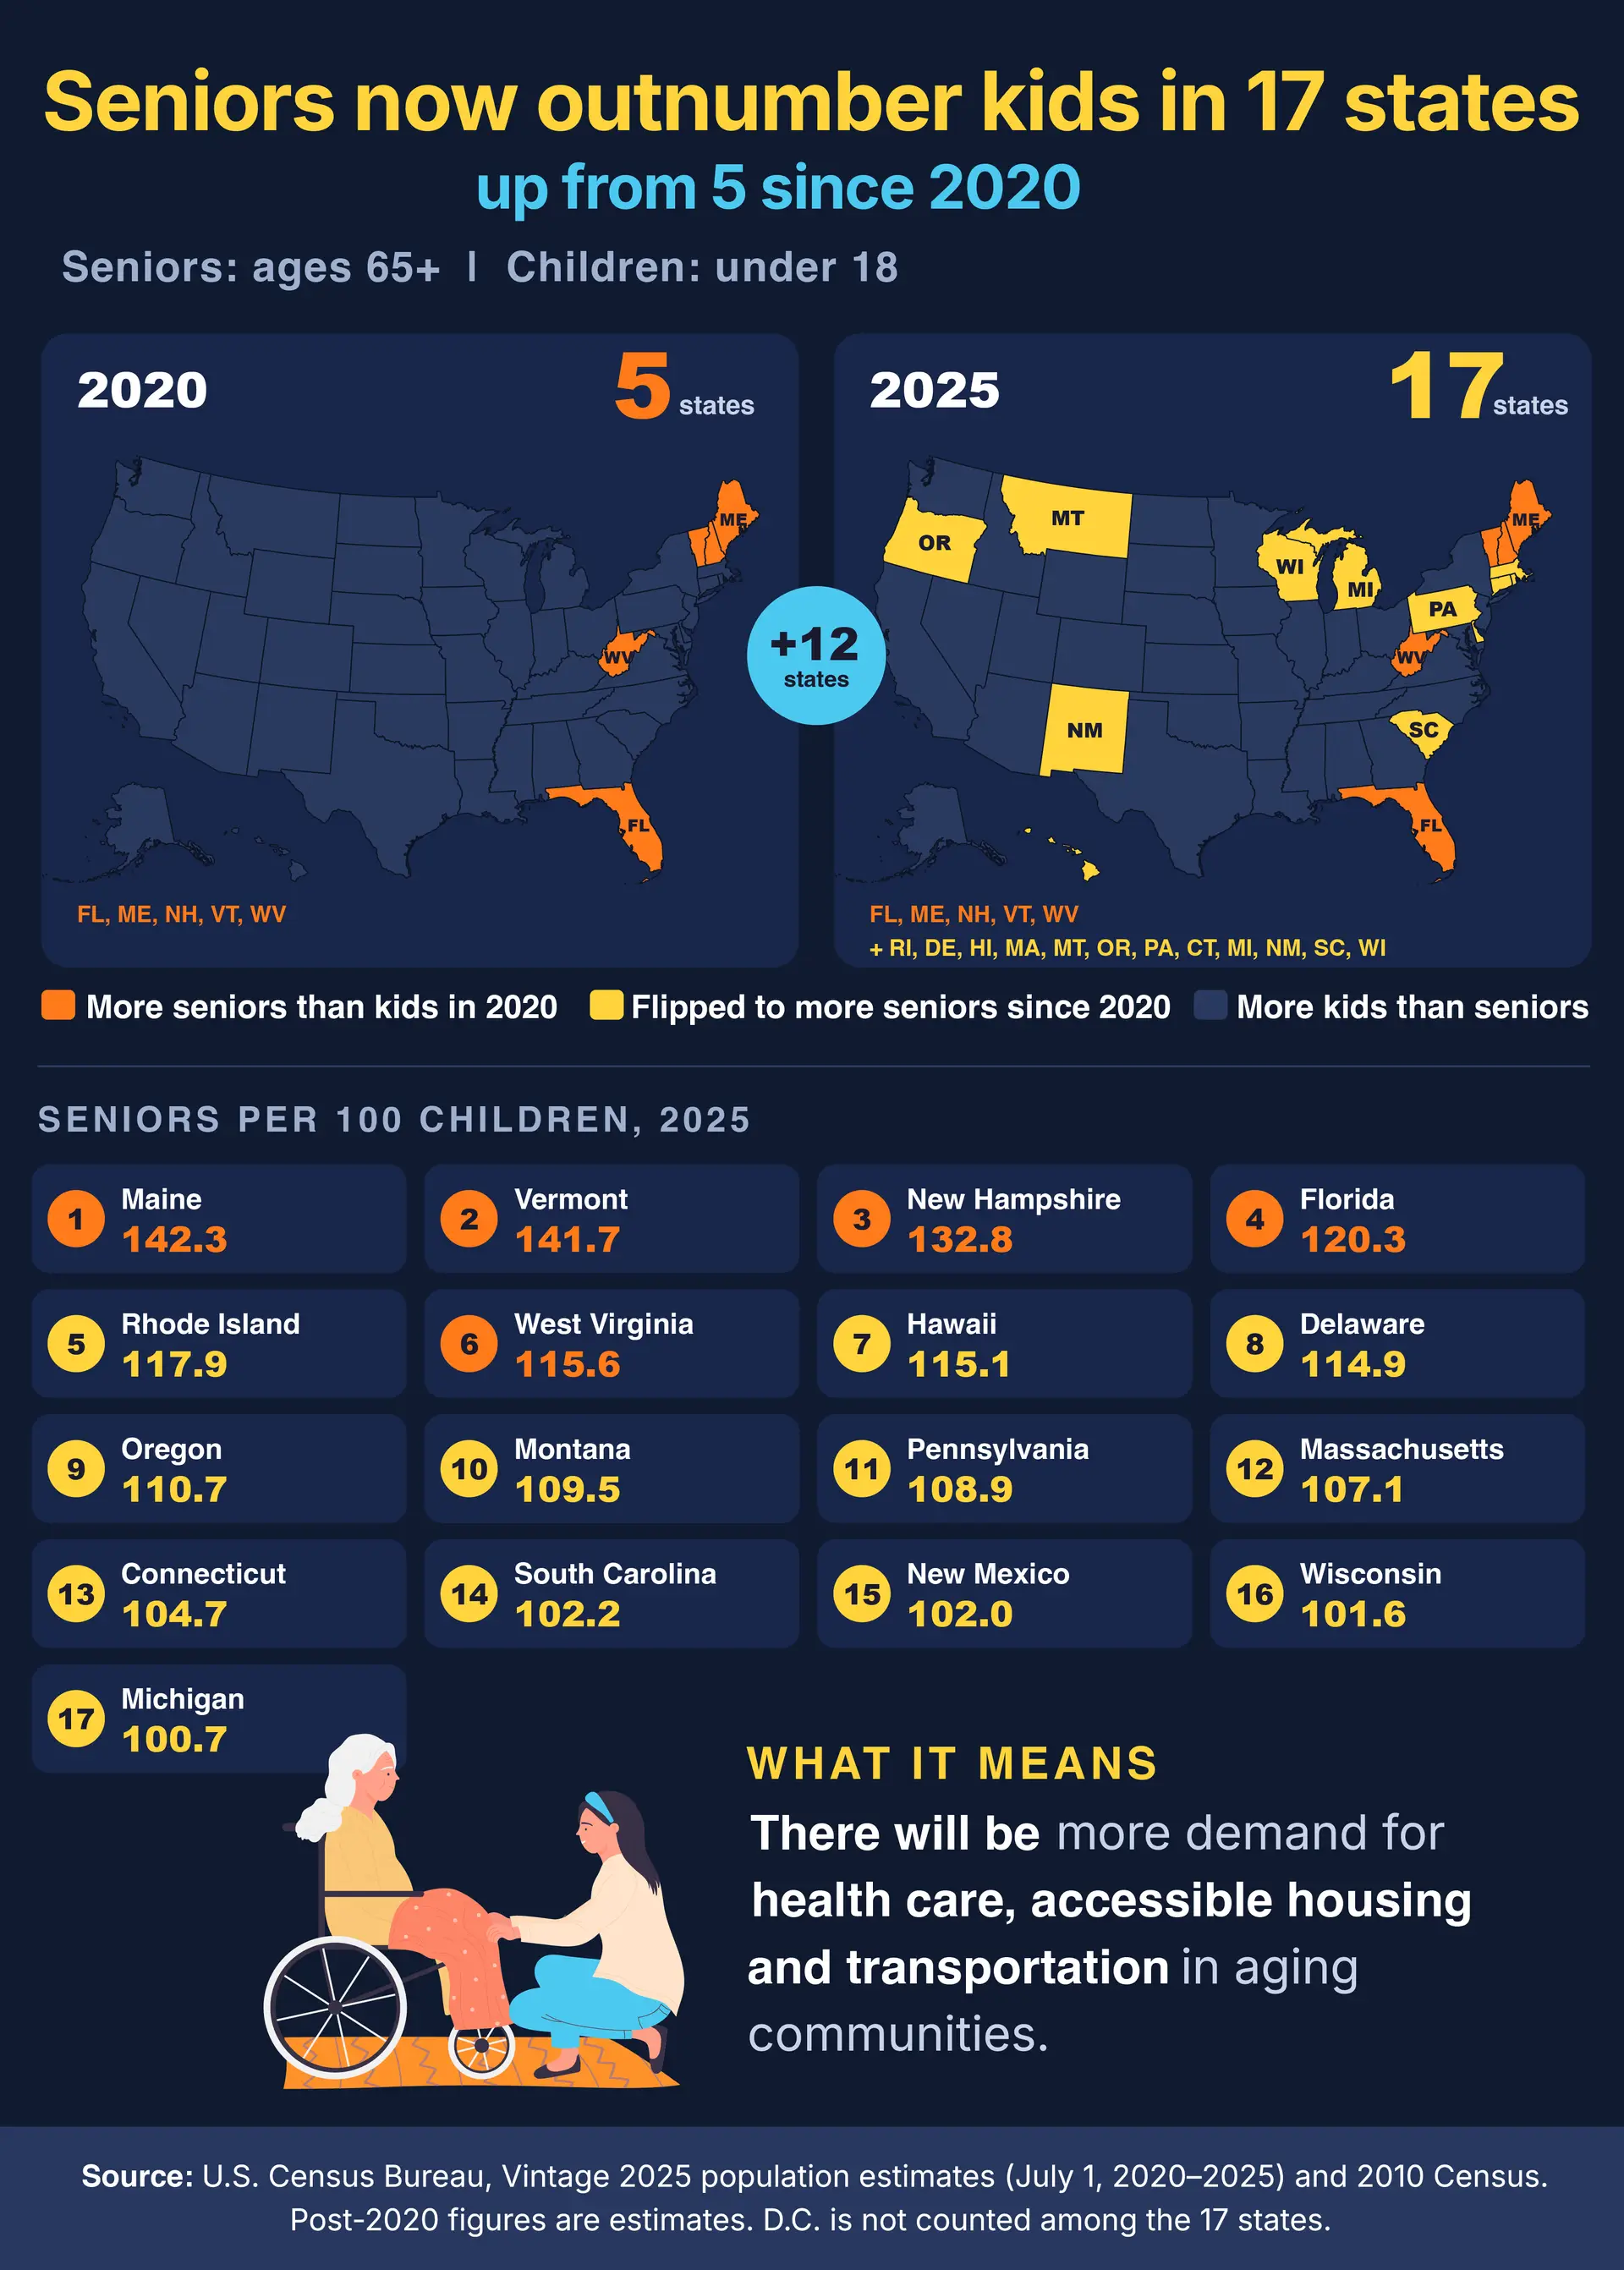
Fifteen years ago, no U.S. state had more seniors than children. Today, 17 do.
And it’s not just retirement favorites like Florida. Michigan, Wisconsin, and New Mexico have joined the list, showing how far the trend has spread across the country.
Using the latest U.S. Census data, we mapped when each state reached this point and how the balance between seniors and children vary across the country.
Key Takeaways
- Four states crossed the line in 2025. Michigan, New Mexico, South Carolina, and Wisconsin.
- Maine leads the country with 142 seniors per 100 children, while Utah has just 50.
- New York is almost there, with 99 seniors for every 100 children.
How America went from zero states to 17
In 2020, only five states had more seniors than children: Florida, Maine, New Hampshire, Vermont, and West Virginia. Rhode Island followed in 2021, crossing the line by a narrow margin of just 150 people. Delaware and Hawaii joined in 2022. Another four states followed in 2023: Massachusetts, Montana, Oregon, and Pennsylvania. Connecticut became the 13th state in 2024.
Then came 2025, when Michigan, New Mexico, South Carolina, and Wisconsin pushed the total to 17. The margins in some of these newly added states are very small. Michigan, for example, had 2,076,467 seniors and 2,062,770 children in 2025, a difference of just 13,697 people. Wisconsin crossed with a gap of only 19,440 people.
Maine has nearly three times Utah's ratio of seniors to children
Florida is famous for its retirees, yet Maine leads the country when we compare seniors with children. For every 100 children under 18, Maine has approximately 142 residents aged 65 and older. Vermont follows closely with 142, while New Hampshire has 133. Florida comes fourth, with 120 seniors per 100 children.
At the other end is Utah, where there are only about 50 seniors for every 100 children. Texas is next, with 62, followed by Alaska with 68.
Which states are closest to having more seniors than children?
Some states that haven't crossed the line are already very close.
New York has approximately 99 seniors for every 100 children, while Arizona has about 98. Both still have more children, though the gap is very small. In New York, the difference is just 44,840 people, compared with a state population of nearly 20 million. Arizona has only 25,542 more children than seniors.
Wyoming and Ohio are also close, with about 96 and 95 seniors per 100 children, respectively.
Whether these states cross the line in the coming years will depend on births, deaths, and people moving in or out.
Why are seniors outnumbering children in more states?
Two major changes are driving this trend: Baby Boomers are getting older, and Americans are having fewer children. Between 2020 and 2025, the U.S. population aged 65 and older grew by nearly 9 million, while the number of children fell by 1.8 million.
Where people choose to live also matters. Some states attract more retirees, while others have larger populations of young families.
The United States still has more children than seniors
Despite the growing number of states where seniors outnumber children, the country as a whole has not reached that point.
The U.S. Census Bureau's 2025 population estimates show approximately 72 million children under 18 and 64.6 million people aged 65 and older. The difference is now about 7.4 million people, down from 18.2 million in 2020.
Over those five years, the number of older Americans grew by nearly 9 million, while the population of children declined by 1.8 million.
For communities across the country, an aging population can mean greater demand for healthcare, accessible housing, and transportation services.
Find your state: Seniors versus children in 2025
The table below shows the number of residents aged 65 and older compared with children under 18 in every state and Washington, D.C.
| State | Age 65+ | Under 18 | Seniors per 100 children | Crossed in |
|---|---|---|---|---|
| Alabama | 1,009,814 | 1,117,927 | 90.3 | Not yet |
| Alaska | 116,192 | 171,700 | 67.7 | Not yet |
| Arizona | 1,571,773 | 1,597,315 | 98.4 | Not yet |
| Arkansas | 591,966 | 698,768 | 84.7 | Not yet |
| California | 6,901,168 | 8,174,798 | 84.4 | Not yet |
| Colorado | 1,029,188 | 1,220,203 | 84.3 | Not yet |
| Connecticut | 751,845 | 718,295 | 104.7 | 2024 |
| Delaware | 241,321 | 209,989 | 114.9 | 2022 |
| District of Columbia | 94,423 | 124,070 | 76.1 | Not yet |
| Florida | 5,346,788 | 4,442,722 | 120.3 | By 2020 |
| Georgia | 1,884,140 | 2,505,970 | 75.2 | Not yet |
| Hawaii | 324,150 | 281,717 | 115.1 | 2022 |
| Idaho | 379,157 | 472,102 | 80.3 | Not yet |
| Illinois | 2,379,145 | 2,618,601 | 90.9 | Not yet |
| Indiana | 1,284,435 | 1,576,165 | 81.5 | Not yet |
| Iowa | 649,656 | 719,648 | 90.3 | Not yet |
| Kansas | 561,319 | 682,768 | 82.2 | Not yet |
| Kentucky | 868,019 | 1,016,783 | 85.4 | Not yet |
| Louisiana | 868,225 | 1,049,955 | 82.7 | Not yet |
| Maine | 347,617 | 244,245 | 142.3 | By 2020 |
| Maryland | 1,149,859 | 1,336,867 | 86.0 | Not yet |
| Massachusetts | 1,421,793 | 1,327,574 | 107.1 | 2023 |
| Michigan | 2,076,467 | 2,062,770 | 100.7 | 2025 |
| Minnesota | 1,113,573 | 1,283,313 | 86.8 | Not yet |
| Mississippi | 571,344 | 658,440 | 86.8 | Not yet |
| Missouri | 1,230,134 | 1,360,128 | 90.4 | Not yet |
| Montana | 253,772 | 231,653 | 109.5 | 2023 |
| Nebraska | 368,331 | 479,249 | 76.9 | Not yet |
| Nevada | 599,211 | 678,525 | 88.3 | Not yet |
| New Hampshire | 325,383 | 245,065 | 132.8 | By 2020 |
| New Jersey | 1,767,250 | 1,990,926 | 88.8 | Not yet |
| New Mexico | 448,253 | 439,452 | 102.0 | 2025 |
| New York | 3,860,551 | 3,905,391 | 98.9 | Not yet |
| North Carolina | 2,119,438 | 2,359,942 | 89.8 | Not yet |
| North Dakota | 143,139 | 182,970 | 78.2 | Not yet |
| Ohio | 2,398,129 | 2,531,907 | 94.7 | Not yet |
| Oklahoma | 741,085 | 957,701 | 77.4 | Not yet |
| Oregon | 898,568 | 811,814 | 110.7 | 2023 |
| Pennsylvania | 2,799,790 | 2,570,631 | 108.9 | 2023 |
| Rhode Island | 233,061 | 197,654 | 117.9 | 2021 |
| South Carolina | 1,173,259 | 1,148,440 | 102.2 | 2025 |
| South Dakota | 181,082 | 220,142 | 82.3 | Not yet |
| Tennessee | 1,360,588 | 1,575,727 | 86.3 | Not yet |
| Texas | 4,711,381 | 7,600,514 | 62.0 | Not yet |
| Utah | 460,179 | 922,267 | 49.9 | Not yet |
| Vermont | 155,289 | 109,614 | 141.7 | By 2020 |
| Virginia | 1,633,891 | 1,860,305 | 87.8 | Not yet |
| Washington | 1,460,563 | 1,634,836 | 89.3 | Not yet |
| West Virginia | 398,189 | 344,349 | 115.6 | By 2020 |
| Wisconsin | 1,241,547 | 1,222,107 | 101.6 | 2025 |
| Wyoming | 121,648 | 127,334 | 95.5 | Not yet |
Showing 10 of 51 entries
A ratio above 100 means more seniors than children. “By 2020” means already above 100 in 2020. Source: U.S. Census Bureau, Vintage 2025; calculations by Omni Calculator.
How we calculated this
We used U.S. Census Bureau population estimates for July 1, 2020–2025, and the 2010 Census for the earlier comparison.
To compare states of different sizes, we divided the number of residents aged 65 and older by the number of children under 18, then multiplied by 100.
For example, Maine had 347,617 seniors and 244,245 children in 2025, resulting in about 142 seniors per 100 children.
For 2021–2025, the year shown is the first year the state's senior population exceeded its child population in the Census estimates. The five states already above that threshold in 2020 are marked separately.
All post-2020 figures are population estimates rather than complete census counts. Washington, D.C., appears in the table but is excluded from the count of 50 states.

loading