The moving average calculator is a famous and powerful tool that indicates when you should sell or buy a stock for maximum profits or reduced losses. This article will cover the moving average, which details what insights this technical indicator gives to the investor, how to calculate the moving average, and we will review a real example.
What is the moving average?
The moving average is a technical analysis indicator that averages an asset's price fluctuations and tries to point out price direction. Note the picture attached below. The blue line represents price fluctuations, while the orange line is the moving average indicator.
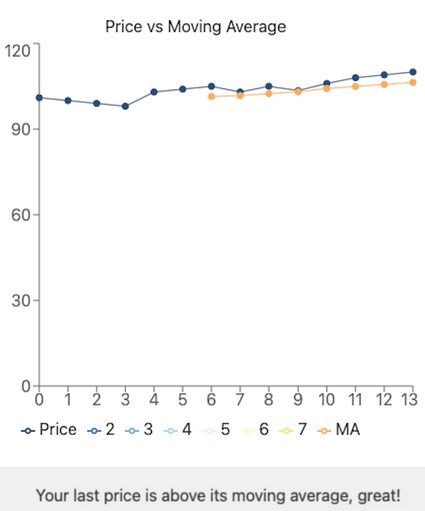
As its name suggests, the moving average indicator gets the mean of a set of price values over a certain period and gives a smoothed representation of how the prices were changing. It is called ''moving'' because the results change when more recent price data appears.
To get the average to move, you have to add a new price to the data set and subtract the oldest one. That result is then divided by the previously defined length of the moving average
Because it averages price volatility and shows average price direction (uptrend, sideways, or downtrend), it can give ideas about when to sell or buy a stock for maximum profit. Let's discuss how to work out the moving average.
How to calculate the moving average
You can directly go to our simple moving average calculator and try to find it out yourself, or keep reading for checking the formula.
- As mentioned, you need a data set of prices long enough, at least, as the period you want to analyze.
- Average it. Here you have your first moving average data.
- Remove the first point and add the new one.
- Divide the new dataset by the previously defined length of the moving average to get the new average. Here you have your second moving average data.
- Repeat with each new data you obtain, keep the moving average data.
- Build a graph: price vs. moving average.
In other words:
Moving average 1st point = (Price #1 + Price #2 + ...Price #n) / n
Moving average 2nd point = (Price #2 + Price #3 + ...Price #(n+1)) / n
Moving average 3rd point = (Price #3 + Price #4 + ...Price #(n+2)) / n
And so on.
Note that the bigger the length of the moving average, the more data you will require. If somebody asks you to calculate the 30-day moving average, you will need at least the first 30 data points to even start and much more for building up a graph with a relevant trend.
Usually, investors and analysts build up a graph that includes price and moving average values through months or years to get an idea of where the business is going.
Insights by the simple moving average calculator for investors
For this section, we will use the SPY ETF, which is covered in our expense ratio calculator, and its price fluctuation during the coronavirus stock market crash.
If it is the first time you've heard about this asset, an ETF means exchange-traded Fund, and it is like a basket of securities that you can purchase/sell in a single operation.
The SPY ETF tracks the index SP500, which represents the 500 most important companies in the US market. Thus, by investing in the SPY ETF, it is like you would be buying a percentage of each of the 500 companies that constitute that index.
Besides, we consider ten days of analysis for the moving average indicator.
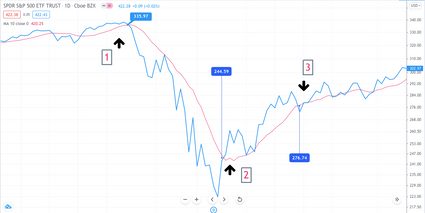
In point #1, you can see how the price (blue) crossed down the moving average line (red). This indicates a change in the trend, and in this case, it points out that a price reduction will likely occur.
You can find similar examples of this situation when companies report less than expected revenue growth or a less convenient interest coverage ratio.
If you're not yet familiar with the notions we've mentioned above, visit our revenue growth calculator and interest coverage ratio calculator to discover them!
In point #2, you can notice how the price breaks the moving average, and actually, in a very aggressive way. As mentioned previously, this situation indicates a change in the trend, and in this case, a price increase is probable to occur.
Another example of this "price behavior" can be seen when a company reports higher than expected EPS growth or positive operating cash flow.
Lastly, in point #3, you see how briefly price crossed down the moving average and immediately crossed back up. This moment shows that the moving average indicator alone cannot predict the price trend change 100% of the time.
To get more reliable price trend information, you have to include more data. Analysts get an idea of the economic cycle with the direction of a weekly moving average or even yearly. We invite you to try our simple moving average calculator with your favorite stock, including data from the last ten years.
How to use our online moving average calculator
It's time to briefly explain how to work out the moving average with the help of our online moving average calculator. As you might have seen already, it's really easy to input your prices into the tool. These can be daily, weekly, or yearly prices. There are no problems, even considering the average price during 5-minute periods. Then you have to decide the length of the moving average.
Remember that the longer the analysis period, the more data you will require, but trend indication will also be more reliable. For example, a trend shift from an uptrend to a downtrend, resulting in a 30-day moving average calculation, cannot be compared with a 2-year moving average calculation result. The latter one is way more meaningful.
FAQs
What does it mean when the price curve crosses the moving average curve?
We interpret the moving average curve as the market sentiment. When it is an uptrend, the market has positive feelings about the referring asset. When it is a downtrend, the market has the opposite opinion. Consequently, when the price crosses the moving average, it indicates that the market sentiment has changed, and the previous trend is very likely to go in the opposite direction.
How to work out the moving average?
- Define the length for the moving average.
- Get a data set of prices long enough as the period you want to analyze.
- Average your data set by the length of the moving average. Here you have your first moving average value.
- Remove the first point and add the new one.
- Divide the new dataset by the previously defined length of the moving average to get the new average. Here you have your second moving average value.
- Repeat with each new data you obtain.
How to calculate a 200-day moving average?
- Get your first 200-day prices.
- Average your dataset by dividing the sum of the prices by 200. Here you have your first moving average value.
- Remove the first point and add the new one.
- Divide the new dataset by 200 again. Here you have your second moving average value.
- Repeat with each new data you obtain.
What is the moving average indicator?
The moving average indicator is a dynamic average of a dataset of prices over a specified length (period of analysis). We interpret it as a dynamic support/resistance line. In technical analysis, a support line is a region where sellers of a stock are outpaced by the buyers; thus, the price is supported and cannot go lower. On the contrary, a resistance line is a region where buyers are outpaced by sellers. Too much selling pressure does not allow the price to go up further.