The interest coverage ratio calculator (also named as times interest earned ratio) is a tool that, based on the interest coverage ratio formula, shows the investor how many times company earnings cover interest payments before interest and taxes (EBIT). Investors consider it one of the most critical debt ratio and profitability ratios because it can help you determine if a company is likely to go bankrupt beforehand.
This article will use interchangeably interest coverage and times interest earned ratio formulas since both are the same; meanwhile, you will understand what the ratio means and how to use it for comparing companies.
What is the financial ratio interest coverage?
On a corporate level, companies can go to the stock exchange to sell a percentage of their ownership in return for cash. This is known as equity financing. However, they have a second way, and it is called debt.
The main difference between the two is that when you get debt, you have to pay a loan amortization, which is spread into the principal and its interest. With the equity financing option, no payment is obligatory.
Debt is paid with the earnings generated by operations. So, for a company to be sustainable, money coming in has to be enough to cover debt interests, if any, and taxes.
Hence, it is required to find a financial ratio to link earnings before interests and taxes with the interest the company needs to pay. The solution is the interest coverage ratio formula. With it, you can not only track when a company is earning more money than the interest it has to pay but also when the earnings are getting worse and the risk of credit default is increasing.
Interest coverage ratio as a debt ratio
Times interest earned ratio is a debt ratio whose purpose is to allow investors and creditors to measure the level of financial risk the company has.
The different debt analysis tools, such as current ratio calculator and the quick ratio calculator, are complementary to the interest coverage ratio calculator because they show different information. The latter focuses on cash inflows and outflows rather than on current assets and current liabilities like the former one.
Times interest earned ratio as a profitability ratio
Debt can be a tool for expanding the company. For example, Aceros Arequipa () is a steelmaker that got several millions of dollars for financing the construction of a new steel mill. The purpose was to diversify their steel products and offer to take more market share (higher revenues and increased net incomes). This would clearly improve their profit margin.
If you would like to go deeper into profitability, check out our other financial tools like the return on capital employed calculator and the ROIC calculator.
Times interest earned ratio formula and how it works
We will start defining the period length. The interest coverage ratio (ICR) is preferred to be calculated by quarters, but it is the same result with yearly data.
-
First, we have to find (EBIT) in the Income Statement. In some cases, companies do not specify it directly but do not panic. A good proxy is the operating income. Both are acceptable because they represent the portion of earnings not affected by interest or taxes.
-
Then, we have to find interest expenses (IE) on the Income statement. Next, by using the time interest earned ratio formula, we have:
What does interest coverage ratio tell investors?
In short, it indicates the level of safety that a company has for debt interest repayment. More in detail, its value and, most importantly, its trend can help us predict the company's future financial situation and see if it will go through stability or likely bankruptcy.
The problem happens if we are getting close to a value of 1. Lenders become more cautious since it means the risk of credit default for them increases. Besides, any bump in the market could make the company non-profitable.
Suppose the interest coverage ratio goes below 1. In that case, it means the company is not generating enough to pay the interest on its loans and might have to dig into the cash reserves, affecting company liquidity.
All of this brings the most critical question, What is a good result for the interest coverage ratio calculator?
As a rule of thumb, investors generally look to have at least an interest coverage ratio greater than 3. In other words, we are looking for companies that are currently earning (before paying interest and taxes) at least three times what they have to pay in interest.
Main reasons why a company may reduce its interest coverage ratio
Keeping in mind the positions of the financial data on the interest coverage ratio formula, we can infer the following two main reasons:
-
The company might have decreasing earnings relative to the interest expenses. This usually happens because new competitors have appeared, company products are no longer in demand, or strategy marketing is no longer effective.
-
The company might have got loans to acquire assets, but these assets are not providing the expected return. An example of this situation happens when a company diversifies its business model into areas of no expertise. Higher interest payments but the same earnings as before taking out the loan will mean a lower coverage ratio.
How to use debt ratios for comparing companies?
Before using the interest coverage ratio for analyzing companies, it is essential to remember that this financial ratio is a metric for understanding a company's health and profitability. Given this, we can continue as follows:
-
First, remember that the trend is the key. We have to check the financial ratios for several years in the past. Do not forget to consider: profitability ratio, liquidity ratio, and debt ratios altogether.
-
Determine who has larger times interest earned. Ideal value depends on the industry sector and maturity stage of the company. Suppose it is not getting cash through financing. In that case, it might probably mean that the company is on a maturity level with limited expected growth or that the company cannot find profitable investment opportunities. Both situations are not good odds for the investor.
Another aspect to be considered is the similarity in business models and company size. A large and settled one will likely experience less volatility in their earnings than a small/mid company. So try to match as much as possible competitors, considering, for example, the level of revenues.
Real examples: Lockheed Martin Corp vs. Boeing Company
This section will compare Lockheed Martin Corp and Boeing Company, both related to the airplane manufacturing industry, based on their interest coverage ratio.
Although Lockheed Martin doesn't build commercial airplanes, they are considered matching competitors because both manufacture products for air/space defense, and both are in the same revenue level: 50-100 billion US dollars.
NYSE: LMT
And by using our spectacular interest coverage ratio calculator, we get:
NYSE: BA
Obtaining, after applying the times interest earned ratio formula:
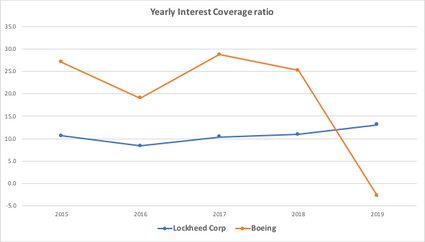
Then, if applied for the past five years:
And, if checked quarterly:
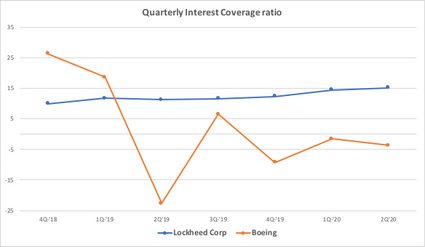
Note that for Lockheed Martin, the coverage ratio is high and stable. That is why people consider it a reliable company worth having in their retirement investing plan.
The investment return you could have gotten if invested in Lockheed in 2010 would be 661%. On the contrary, with Boeing, you would have had 219%. This result can be easily verified by knowing the historical stock price and by using our famous return of your investment calculator.
In conclusion, as it is always said, it is vital to understand what you are paying for when you invest. For that reason, it is essential to have a broad understanding of the business and how it is performing financially. That's why we highly recommend you check our other financial calculators.
Finally, as one of the most successful investors said, ''price is what you pay, value is what you get''. How to know if we are paying a fair price? For such an important endeavor, besides this interest coverage ratio calculator, we propose you check the following valuation methods: discounted cash flow and EBITDA multiple on our website.