The operating cash flow calculator is a handy tool that allows you to calculate the real money a company is getting from operations; in more sophisticated words, it gives you the net cash flow from operating activities. Operating cash flow (OCF) is one of the primary fundamental values that any business owner and investor need to understand.
Because of that, in this article, we will cover what is operating cash flow, how to calculate it by using the OCF formula, and finally, how to interpret the cash flows for analyzing future company growth.
What is operating cash flow?
The OCF represents the real cash a company received during the fiscal period because of operating activities. Providing services, selling inventory, any deferred revenue, and costs related to future contracts are all examples of operating activities that may generate a cash flow for the company. That's it, as simple as it sounds.
From that definition, we can say already that the operating cash flow is a more reliable profitability value than net income because it shows real money. As explained in the free cash flow calculator, net income is discounted by items that are not real cash, such as depreciation, amortization, and stock-based compensation expenses, among others.
Because of this problem, investors tend to rely on EBITDA. However, even EBITDA does not take into account important cash flows variations like changes in inventory levels or accounts receivables/payables.
Consequently, cash flow from operations is crucial for business owners and investors because it shows if the company can maintain itself and grow based on real money transactions.
How to calculate the operating cash flow?
Several elements are included in the operating cash flow formula. Here they are expressed in two main equations:
where:
- — Operating cash flow
- — Net income
- — Depreciation
- — Amortization
- — Change in the operating working capital, which we calculate as the change of inventory (), accounts receivables (), and accounts payable ()
- — Income tax payable
- — Net of other cash flows: This item can include cash flows from deferred revenues and stock-based compensation, among others.
Note we are adding back depreciation and amortization because it was an accounting cash flow, not a real one. Regarding the change in operating working capital, we have the following:
- Change in inventory (): It includes the acquisition and consumption of inventory. It is usually calculated by the difference between inventory levels:
where:
— Refers to inventory level at the beginning of the period; and
— Refers to inventory level at the end of the period.
An increase in inventory levels () represents a cash out-flow because the company spent money on getting more inventory. That is why the equation result has to be a negative value. On the other hand, a decrease in inventory levels () means an operating cash in-flow because inventories were consumed or sold. Thus, it has to be a positive value.
- Change in accounts receivables(): This item refers to the money that clients have to pay to the company for the goods or services provided. Because this is not a cash item, we check only the variation in it:
where:
— Refers to accounts receivables at the beginning of the period; and
— Refers to accounts receivables at the end of the period.
Like inventory levels, an increase in accounts receivables () means more money in debt to the company that is considered a cash out-flow; thus, our math value has to be negative. On the other hand, a decrease in accounts receivables () points to customer's payments, indicating positive operating activities cash flow.
- Change in accounts payable (): Contrary to the previous one, this item refers to the company's debt with its providers/suppliers.
where:
— Refers to accounts payables at the beginning of the period; and
— Refers to accounts payables at the end of the period.
Notice that if the accounts payable increases (), we have a cash inflow because raw materials are provided to the company without being paid yet. It refers to cash that has not left the company, a positive cash flow. Contrastly, if accounts payable decreases (), cash leaves the company to pay those debts, which is a negative cash flow.
In case you only have the exact amounts for inventories, accounts receivables, and payables from the balance sheet, you still can get a reliable proxy for the change in operating working capital. You can do so by opening the section of Balance changes of our incredible operating cash flow calculator. It is critical to mention that variations of the mentioned items throughout the year can be complicated, so it will not be 100% accurate.
Moreover, income tax payable represents the real cash used to cover all taxes, including the ones coming from investing and financing. Taxes registered in the income statement are only related to the goods or services provided.
Lastly, we've added an extra item: net of other cash flows. It represents all additional operating cash flows that are exclusive to each business. For example, we would put here the deferred revenues like agreements for subscriptions in the case of a SaaS (Software as a Service) company.
How to interpret cash flow from operating activities?
In short, we want to see a cash flow from operating activities that is positive and growing. Here it is handy to use the CAGR calculator and get the growth rate of the operating cash flow because it would give us a real sense of the rate of evolution of our company.
Besides, net cash flow from operating activities can give you an insight into the future of a company earlier than other financial values like earnings per share. Here we will discuss two situations:
-
Net operating cash flow increasing and higher than net income: A cash flow from operating activities in these conditions can only mean a successful company that is generating more and more money. Even if the net income is negative, an OCF >0 can indicate near-future accounting profitability.
-
Net operating cash flow decreasing and lower than net income can only mean bad times for the business. Basically, the company is earning less and has fewer profits. In cases where cash from operating activities is negative, even if the company still has a positive net income, you should get away from it.
Another important usage we give to the cash flow from operating activities is for debt analysis. Financial tools like interest coverage ratio calculator or cash flow to debt ratio calculator can provide a very accurate picture of a company's capability to deal with debt, even more precise than EBIT.
Operating cash flow calculator applied to a public company
Let's review an example of cash flow from operations calculation. The following company: Fortinet (NYSE: FTNT) is a cybersecurity company that provides anti-hacking equipment and software for enterprises with different businesses connected through the web.
By reviewing its , we find the following information:
For the net of other cash flows, we will sum up all the items not mentioned above. Then we get:
Note that in this item, we are taking into account relevant cash flows like stock-based compensation (174.1 USD million) and deferred revenue(446.7 USD million). Both, as mentioned above, are very business-type-specific.
As explained on page 91 of the report, the first one has previously been considered as a cost expense that, in reality, is a non-cash item since it represents payments to employees in stock options or equivalents. The second one relates to services that have been invoiced but are not considered as revenue because they have not been entirely executed.
Finally, and by using our cool operating cash flow calculator, we get:
If we conduct the same exercise for the last 5 years, we will find out the following trend:
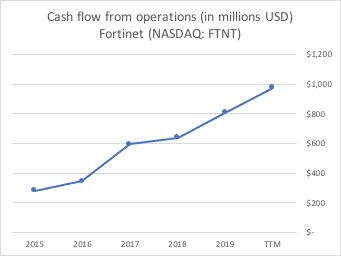
*TTT= twelve trailing months
It is amazing to see how much the operating cash flow has grown from 2015 to this day. As a consequence, the market capitalization of the company has risen from 5.05 billion USD to 21.1 billion USD, providing a return on investment of 323%.
Finally, operating cash flow is not the only financial value we have to keep in mind when investing. Consequently, we invite you to check out our other fantastic financial calculators.
FAQs
How to find operating cash flow?
Operating cash flow can be found towards the top of a cash flow statement. A cash flow statement is one of the three financial statements that all public companies have to present each quarter: income statement, balance sheet, and, of course, cash flow statement.
How to calculate operating cash flow?
- Get net income from the income statement.
- Add depreciation and amortization to net income.
- Take into consideration the change in operating working capital: inventories, accounts receivables, and accounts payables.
- Add any income tax payable.
- Add any other item that was considered as a expense in the income statement that was actually not a cash outflow, e.g., stock-based compensation.
- Add any deferred revenue or deferred contract because they are indeed cash inflows.
- The sum of all these additions is your operating cash flow.
What is a good operating cash flow?
A good operating cash flow is one that grows quarter by quarter at a considerable growth rate. If your company's operating cash flow is growing at a 10% compound annual growth rate (CAGR), it will double in 7.2 years.
How long until operating cash flow doubles?
The time until operating cash flow doubles depends on the compound annual growth rate (CAGR) of the company. If we consider a company with a CAGR of 50%, the company operating cash flow will double in 1 year and 8 months.
What is the operating cash flow formula?
In a nutshell, the formula is: operating cash flow = net income + non-cash expenses + changes in working capital. We can find items such as depreciation, amortization, stock-based compensation among others in the "non-cash expenses" item.
Why is operating cash flow important for investors?
- If operating cash flow is positive and growing from quarter to quarter, it can predict business success, particularly if the company is still profit negative.
- A stagnation or shrinkage in operating cash flow can be very detrimental to the stock value. We recommend considering selling the stock if the operating cash flow turns negative.
- If operating cash flow is growing, free cash flow can become positive and even grow, depending on the company's expenses of course. Then stock buybacks or dividends might be paid in order to reward investors.
Is operating cash flow the same as net income?
No. Net income considers accounting non-cash expenses such as amortization and depreciation; meanwhile, operating cash flow only considers cash items. Thus, the main difference is that one represents real money and the other, only partially.
How to improve cash flow from operations?
- Sell more. It's obvious but an increase in revenues will ideally increase net income and thus, increase cash flow from operations.
- Reduce the cash spent on working capital or increase the cash inflow from working capital. For example, you can hold lower levels of inventory, meaning you will sell more of it which is a cash inflow that comes from operations.
- Aim to sell more services as a subscription. An example can be a software license that has to be paid per month or an equipment maintenance subscription service.
How to calculate operating cash flow from income statement?
It is impossible as you need at least you another piece of information: the balance sheet. To calculate the operating cash flow, you take the net income and add to it all non-cash expenses stated in the income statement. Besides, you analyze the balance sheet and get all the cash outflows/inflows related to working capital, then add them to the operating cash flow. Finally, consider all other cash inflows/outflows such as deferred revenues and paid taxes.
What to do if a company I invested in reported negative operating cash flow?
You should consider selling. However, this is not a rule. There are companies that start reporting decreasing/negative operating cash flow but recovers in a few quarters. It is very likely that during that time, the company price per share decreases dramatically, creating a buying opportunity for a risk taking investor.