Cash flow to debt ratio calculator is a coverage ratio tool that measures how much indebted a company is relative to the cash flow generated from operations during each fiscal period. This article will cover the cash flow to debt ratio, its interpretation from an investor point of view, and a real example of cash flow to debt ratio analysis. You don't want to miss it!
What is the cash flow to debt ratio?
Cash flow to debt ratio is a coverage ratio used to measure how capable a company covers its total debt. Similar to the interest coverage ratio, explained in our interest coverage ratio calculator, it indicates how healthy a company is.
This ratio uses the cash flow from operations (CFO) instead of net income because the former is a more clear representation of the company's real earnings. To learn more about operating cash flow, visit our operating cash flow calculator.
As explained in the free cash flow calculator article, net income is affected by several non-cash items, such as depreciation and amortization. Besides, it does not take into account cash flows from changes in working capital, like increases or decreases in inventory levels. Visit our inventory turnover calculator to learn more about inventory levels.
Investors might consider that it is more accurate to use EBITDA or EBIT; however, none of them take into account deferred income related to future contracts. Consequently, the ratio would probably be more alarming than reality, making us fall into an early misjudgment. That is why it is important to manage a ratio that compares real net cash inflow with total debt.
How to calculate cash flow to debt ratio?
The cash flow to total debt formula has two components that combine as follows:
where:
- — Cash flow to debt ratio
- — Operating cash flow
- — Total debt
You can quickly obtain the cash flow from operations figures from the cash flow statement; meanwhile, you can typically find the total debt in the quarter/annual report's financial highlights section. In case you are having problems obtaining the total debt, you can get it by the following sum:
where:
- — Short Term Debt: Includes all debt that matures in 12 months or less.
- — Long Term Debt: Includes all debt that matures after 12 months.
The short-term debt will always be in the current liabilities section of the balance sheet, while the long-term debt will be in the non-current liabilities section.
Cash flow to debt ratio analysis
For a proper cash flow to debt ratio interpretation, we need to cover several fiscal periods. Then, we will have to analyze the trend and evaluate accordingly to one of the following scenarios:
-
Operating cash flow increasing, total debt increasing: Cash flow to debt ratio will probably maintain itself, oscillating between specific values. In such cases, you are advised to evaluate a more extended period of time to better understand the trend or understand the capital structure of your company with the debt-to-capital ratio.
-
Operating cash flow increasing, total debt decreasing: Cash flow to debt ratio will likely increase, which is a good sign of positive company evolution. Dividends may start to be paid or even be increased.
-
Operating cash flow decreasing, total debt increasing: Cash flow to debt ratio will increase quickly. We do not recommend investing in such companies. If you are already in, you should consider selling your positions. Better to use our stock profit calculator to see how much you will get/lose for such an investment, considering broker commissions.
-
Operating cash flow decreasing, total debt decreasing: Cash flow to debt ratio may keep itself stable. However, we consider that the only good investment you should have is one that shows positive growth in operating cash flow. We recommend you sell your positions; market capitalization will likely start to fall soon.
Total debt to cash flow ratio formula
The debt to cash flow ratio is simply the reciprocal of the cash flow to total debt formula. You can interpret it as how many times the cash flow is contained in the total debt. The bigger this number means the company has more debt; thus, it may be less able to cover it.
Expand the debt to cash flow ratio section in our nice cash flow to debt ratio calculator after adding the operating cash flow and total debt data to get this value. The result will be there already.
The total debt to cash flow ratio formula is as follows:
where:
- — Total debt to cash flow ratio.
Cash flow to debt ratio example and analysis
On this occasion, we are going to review Boeing (NYSE: BA). Considering its , we have:
Then, by taking into account the next ,
We can clearly see the cash flow to debt ratio deteriorating from 21.36% to 18.97% from quarter to quarter. Besides, the debt-to-cash flow ratio increased from 4.68 to 5.27. That is a clear warning alarm.
Three months after, in the following quarter () we even get a negative operating cash flow (-590 million USD) and a total debt equal to 19.2 billion USD. In fact, the total debt in that quarter had a compound annual growth rate of 58.8% if we compare it with the .
Fast-forwarding to the present, after the release, where the debt reached 61 billion USD, the market capitalization plunged to 93 billion USD, half of the market cap of 180 billion USD reached in 4Q 2018.
An investor who would have used our life-saving cash flow to debt ratio calculator would have been able to cover himself from a loss of 50% in the returns of his investments.
Here, the mentioned data, including other fiscal period values, are presented:
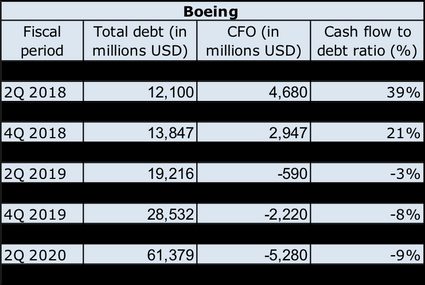
and if we build a graph based on these results:
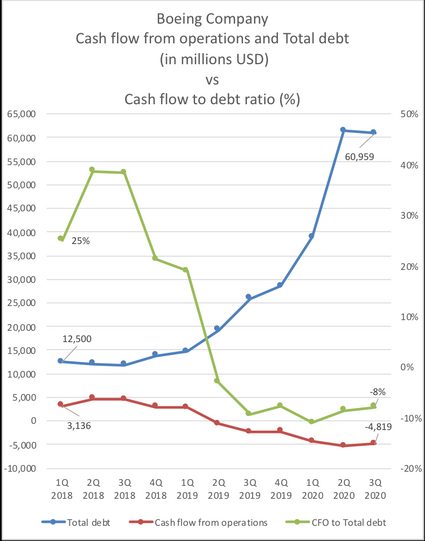
We can clearly notice that the 2018 3rd quarter is the starting point of the divergence. Then, the cash flow from operations (red line) starts to decline, and the total debt (blue line) starts to rise. Also, notice how the cash flow from operations (CFO) to total debt (green line) starts to decrease rapidly.
In conclusion, coverage ratios can warn us when a company might have a crash. A cautious investor would have sold its investment probably during the 2018 4th quarter.