The inventory turnover calculator is a financial efficiency ratio calculator that uses the inventory turnover formula and inventory days formula to understand how fast a company sells its inventory in a certain period. If tracked on a trend basis, it can show investors whether management strategies are improving the efficiency of their production, manufacturing, or selling process or not.
In this article, you are going to learn how to calculate inventory turnover and inventory days. You will find the answer to the next four questions and a real example to understand the interpretation of this ratio better.
- What is inventory?
- How do I calculate the inventory turnover ratio and inventory days?
- What do inventory turnover and inventory days tell investors?
- How to use inventory turnover and inventory days for comparing companies?
What is inventory?
As per its definition, inventory is a term that refers to raw materials for production, products under the manufacturing process, and finished goods ready for selling. Therefore, it includes all the material process transformation.
Some companies might buy manufactured products from different suppliers and sell them to their clients, like clothes retailers; meanwhile, other companies could buy pig iron and coke to start steel production.
Both of them will record such items as inventory, so the possibilities are limitless; however, because it is part of the business's core, defining methods for inventory control becomes essential.
On the Accounting side, we consider inventory as a current asset recorded on the balance sheet. It has a high degree of liquidity, meaning that we expect it to be converted into cash in a short period of time (less than one year).
Once we sell the finished product, the company's costs for producing the goods have to be recorded on the income statement under the name of cost of goods sold or COGS as it's usually referred to. Note that depending on your accounting method, COGS could be higher or lower. See FIFO calculator and LIFO calculator.
Inventory as a part of current assets
For an investor, keeping an eye on inventory levels as a part of the current assets is important because it allows you to track overall company liquidity. This means that the inventory's sell cash can cover the short-term debt that a company might have. If you are interested in learning more about liquidity, how to track it, and other financial ratios, check out our two tools current ratio calculator and quick ratio calculator.
Inventory turnover as a financial efficiency ratio
Operations of a company require cash. At the very beginning, it has to be financed by lenders and investors. Once the company is running, cash for sustaining operations is obtained from the products sold (cash inflow) and from short-term liabilities from financial institutions or suppliers (cash outflow).
In order not to break this chain (also known as Cash conversion cycle), inventories have to turnover. The more efficient and the faster this happens, the more cash a company will receive, making it more robust against any face-off with the market. It is worth remembering that if the company sells more inventory through the period, the bigger the value declared as the cost of goods sold.
Inventory turnover shows how many times the inventory, on an average basis, was sold and registered as such during the analyzed period. On the other hand, inventory days show the investor how many days it took to sell the average amount of its inventory.
For example, let's say Company A has an inventory turnover ratio of or, in other words, the company sold its inventory times a year. Then, by merely dividing , we can conclude that it took to the company days to sell the total of its average amount of inventory. Further details about the inventory turnover ratio formula are discussed in the following paragraphs.
As powerful extra tools, other values that are really important to follow in order to verify a company's profitability are EBIT and free cash flow.
How to calculate inventory turnover and inventory days?
Before starting to review the inventory turnover formula, we need to consider the period of the analysis. The most common length of time used is 365 days representing the whole fiscal year, and 90 days for quarter calculations. In this post, we will consider the period as the former since it will include any seasonality effect that might be during the year.
- Find out the inventory at the beginning and end of the fiscal year. For the case of 2019, we can find this figure if we check the annual balance sheet of 2018 and 2019 for the Beginning and Ending Inventory, respectively. Then we pick both inventory records and calculate the average:
where:
— Indicates the average value of the inventory in the period
— Refers to inventory level at the beginning of the period.
— Refers to inventory level at the end of the period.
- From the income statement of the year to check, we extract the cost of goods sold (), and then we calculate the turnover ratio:
where — Inventory turnover: It measures how efficiently a company manages its inventory for operations.
- Furthermore, once we have the ratio, it is possible to find out how many days the average amount of inventory is turned over by using the inventory days formula:
where — Inventory Days: Refers to the time in which the company sells all its current inventory, expressed in Days.
Of course, you do not need to memorize these formulas like in school because you have our beloved Omni inventory turnover calculator on your left.
What does inventory turnover tell the investors?
First, we will start talking about why we do not have to look at the ratio and the days and not to analyze it independently. If reviewed in that way, they are just simple numbers.
The importance of these values relies on its trend. Then, when we have the values for 3 to 5 years, we can conclude whether the efficiency increases or decreases.
Regarding the inventory turnover, the bigger the number, the better. A high value for turnover means that the inventory, on an average basis, was sold several times for building the entire amount of value registered as cost of goods sold. On the contrary, a low value indicates that the company only processes its inventory a few times per year.
Regarding the inventory days, the lower the number, the better. A large value for inventory days means that the company spends a lot of time rotating its products, thus taking more time to convert them into cash to sustain operations. Conversely, if a company needs fewer days to get rid of its inventory, it will be in a better financial position since the cash inflows will be more robust.
Consequently, as an investor, you want to see an uptrend across the years of inventory turnover ratio and a downtrend for inventory days.
3 reasons a company may be improving its inventory turnover
The main three reasons why a company might be achieving better inventory management can be the following:
-
The company is improving its procurement process. It can be that the company has obtained better suppliers, so getting access to raw materials is easier and faster.
-
The company might have improved its production process, getting products ready to be sold in less time.
-
The company is selling faster. After analyzing clients, improving marketing strategies, or taking more market share, a company might be precisely producing what clients want, thus selling most of its products in a shorter period of time.
On the other side, inventory ratios that are worsening might show stagnation in a company's growth. This could be happening because of problems with suppliers, production processes, or competitors.
This worsening is quite crucial in cyclical companies such as automakers or commodity-based businesses like Steelmakers. If the company is stockpiling, quarter by quarter, more and more stock, a problem is definitely developing, and if you own shares in those cases, it might be better to consider selling and taking profits.
How to use inventory management ratios for comparing companies?
Regarding stock picking, based on the criteria mentioned above, we should choose as follows:
- The one who has a higher inventory turnover, the better.
- The one who has lower inventory days, the better.
- The one that shows the corresponding proper trend slope during the last five fiscal years.
Never forget that it is vital to compare companies in the same industry category. A company that sells cell phones obviously will not have an inventory turnover ratio that is meaningful compared to a company that sells airplanes.
Real examples: Skyworks Solutions and Broadcom
The following two companies develop and sell semiconductor chips for diverse applications like phones, cars, and computers. They are competitors.
To understand how well they manage their inventory, we start reviewing their last fiscal year, and then we apply the inventory turnover ratio formula.
(NASDAQ: SWKS)
And by using our amazing inventory turnover calculator on the left, we get:
(NASDAQ: AVGO)
Obtaining, after applying the inventory turnover ratio formula:
Finally, we use the inventory days formula,
We can conduct the same exercise for the other years for both companies, and we will build the following graph.
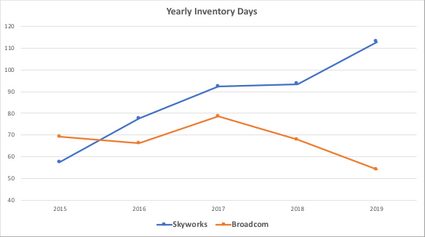
In conclusion, we can see how Broadcom has continuously reduced its inventory days compared to Skyworks, which has just only increased in the last five years. We can infer from the single analysis of this efficiency ratio that Broadcom has been doing better inventory management.
However, it is essential to remind you that this is only a financial ratio. For a complete analysis, an extensive revision of all the financials of a company is required.
Finally, if you are already investing in the stock market or are just considering doing it, you probably have heard the famous phrase:
"Buy low, sell high."
That refers to buying a stock when it's cheap and selling it when it's expensive. Pretty logic, huh? But how is it possible to know when a stock is discounted or overpriced?
For those investing existential questions, you better check the discounted cash flow calculator, which can help you find out what is precisely the proper (fair) value of a stock.