The free cash flow calculator is a tool that helps you compute the free cash flow (FCF) value, one of the most important financial information for an investor. In this post, we will explore what is free cash flow based on the free cash flow definition of cash from operations minus capital expenditures.
We will also explain the free cash flow yield and answer the critical question: how to calculate free cash flow. Finally, we will make clear how to use the free cash flow formula for analyzing companies.
What is free cash flow?
As we have said at the very beginning, Free Cash Flow (FCF for short) is a company's cash generated by operations minus capital expenditures cost. But is that all?
No. That's only the free cash flow definition; however, the meaning is way broader.
What are we looking for, as investors?
We are looking for a return on our investments that is big enough to cover inflation depreciation and can give us an extra amount of money for any expense we would like to make.
That is why we invest. Our investments' return is based on the cash flows that our companies generate after covering all their operational costs. Examples of such expenses are inventory needs, marketing costs, interest payments, taxes, and any cash required for expanding/growing the business. We consider the remaining cash as the free cash flow.
What does FCF tell investors?
Since free cash flow is the remaining cash after all the expenses mentioned above, we can consider it the investor's money. We, as owners, can instruct the management to use it for the following purposes:
- Dividend payment;
- Shares buybacks;
- Debt principal payments; and
- Acquisitions.
All of them, if appropriately managed, can create more wealth for the investor. Thus, we look for a growing and stable free cash flow.
To find out that one of our companies (or one that we are looking to invest in) is reducing its free cash flow from period to period can be an early sign of business problems.
Let's discuss the main advantage of FCF. Free cash flow would, generally, show problems before EBIT or earnings per share covered in our earnings per share calculator. This is because FCF takes into account cash flow from operations but not non-cash gains nor non-cash expenses (like depreciation and amortization). In fact, it considers real cash consumption/generation, such as changes in inventories, accounts payable, and accounts receivable (working capital).
Besides, it can also show the profitability of earlier expansion projects. Together with the financial ratio return on invested capital, FCF can give a complete understanding of management's ability to make the company grow.
Whether a company obtains financing through debt or equity, it is always possible to track the free cash flow and see its impact against debt service (interest + principal) or share dilution. Learn more about free cash flow in our FCFE calculator.
Suppose you would like to see more about financing through debt or equity. In that case, we recommend you check the section What is the financial ratio interest coverage? in our outstanding interest coverage ratio calculator.
Free Cash Flow formula and how it works
The FCF formula consists of two elements: Operating cash flow and Capital expenditures, both obtained from the cash flow statement that companies have to present to the market regulation entity on a quarterly and yearly basis. Generally speaking and very simplified, the document looks like this:
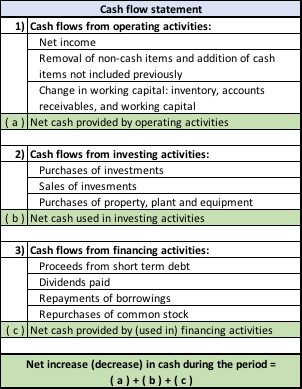
We will get the operating cash flow from section 1). The name is not standardized, but you will usually find it as net cash provided from operating activities or similar.
Regarding capital expenditures, we will get it from section 2). It usually has the name "Purchases of property, plant, and equipment", but it can change slightly as with the other variable. Then, the free cash flow formula is:
where:
- — Free cash flow.
- — Operating cash flow.
- — Capital Expenditures
Before continuing, we would like to address what operating cash flow and CAPEX represents:
-
Operating cash flow means the net cash generated by the operations of our company. As mentioned above, it is a better approach for real cash earnings than EBITDA, covered in our ebitda calculator or net income.
First, EBITDA does not consider working capital. In other words, when investors just compare companies based on EBITDA only, they are saying that it does not matter whether the business is spending 5% of the revenues in running itself or if it's spending 50%.
Second, net income is an accounting construct that does not consider the CAPEX invested in the period. We can argue that it is adjusted by the depreciation of the assets bought as written in the income statement, but that is not equal to the real cash used for acquiring new business or equipment during the last period. FCF includes real CAPEX.
-
Capital expenditures (CAPEX) represent the amount of money directed for expanding/growing the business during the period of analysis. It can include infrastructure, technology, new equipment, and so on. Consequently, regarding this item, there is no consensus on its definition. For our free cash flow calculator, the line item to consider in the financial report will be Purchases of property, plant, and equipment or something similar.
Main reasons why a company may be increasing its FCF
Based on the free cash flow formula, we can see three main reasons why a company is increasing its FCF:
-
The company is increasing its net income or its net income margin.
-
There is a reduction in the working capital, meaning that the company might be using its operating cash more efficiently, probably reducing the cash conversion cycle days.
-
The management decided to reduce the money directed to CAPEX, which implies that probably the company and, consequently, its free cash flow will not grow much more.
How to use FCF for comparing companies?
The best choice is to find a company with a stable compound annual growth rate in its free cash flow. Novice investors should keep themselves away from erratic FCF over time and, even more, from companies reporting negative FCF.
On the other side, one can recognize a successful company before other investors by following its FCF. Take , for example, which started having a positive trailing 12 months (TTM) free cash flow since 2019 second quarter. It has seen a 750% plus return since then.
Free cash flow yield as a financial ratio
The free cash flow yield is a value that indicates how much of the free cash flow generated per share by the company is contained in the current stock price. In a sort of way, cash flow yield is like the earnings yield (reciprocal of price/earnings ratio) because both compare profits to the stock price. However, the former is more reliable because only cash amounts enter into consideration.
To obtain it, we just need to have two more values: Number of shares outstanding and Stock price, or just the company's market capitalization.
To get the number of shares, you can go to the income statement, or you can use our handy market cap calculator. You have to enter the price per share and the market capitalization (very easy to find on Google), and you will get a pretty accurate number of the company's outstanding shares.
After that, and by using the values from the FCF formula, we will have the following:
where:
- — Free cash flow per share
- — Number of shares outstanding
and:
where:
- — Free cash flow yield
- — Stock price
The other way around is:
where:
- — Market capitalization: Equity value, the result of multiplying the number of shares by the stock price.
Of course, our amazing tool can also work as a free cash flow yield calculator. We invite you to try it and find out the investment recommendations we give accordingly to the result you get.
How to calculate free cash flow? Real examples
Now let's consider an example. Synnex Corporation is a US company whose core business is IT services and business process outsourcing. We will analyze it as per the FCF formula and get its FCF value and free cash flow yield. Their contains all the information we need.
Synnex 2019
Then, by using the free cash flow formula:
So, Synnex, during the fiscal year of 2019, produced a free cash flow equivalent to 412,496,000 USD.
Furthermore, we can calculate the free cash flow yield, but we will need the following:
, and
.
The stock price considered is from January 2020, when the annual report was released. Then, our free cash flow yield calculator results:
, and
.
With the free cash flow yield, we can compare it with other companies in their sector. In fact, the reciprocal of the free cash flow yield reflects a very similar idea to the price-earnings ratio. For this case, we would get , meaning the company would need eighteen years to pay its price with the free cash flow it generates. Interesting, uh?
Now, you can say that you know how to calculate free cash flow. Thus, we would like to end this post by recommending you get the whole business panorama. For that, we advise you to check our other handy financial calculators.
Finally, none of the free cash flow definitions matters if you buy a highly overpriced stock. Analysts tend to use the discounted cash flow method to determine whether the stock is cheap. It is definitely more precise for valuing companies than EBITDA multiple for the reasons mentioned in this post; however, it is more time-consuming. Consequently, investors shall decide to pursue efficacy or efficiency, respectively.