The frequency distribution calculator helps you find the distribution frequency of the numbers in the data set. It also enables you to visualize the frequency distribution as a table and also in the form of a frequency distribution chart.
What's more, you'll also learn what cumulative frequency is, how we can construct the cumulative frequency distribution for a given dataset, find the ungrouped frequency distribution, as well as modify it to view the grouped frequency distribution! Note that the term "frequency" can have different interpretations in different domains, but here, we're going to focus on the mathematical aspect of it 😉.
How do we calculate frequency distribution?
To understand the definition of frequency distribution, we need to visualize collecting the numbers into unique buckets. The count in each bucket represents the frequency of the corresponding number in the bucket. This can be shown as a table or in graphical form. For ungrouped frequency distribution calculation, each unique number is treated as a separate bucket.
For example, let's say we have the following 7 numbers in our data set:
-5, 2, 3.1, -5, 3.1, 7, -5.
The frequency distribution for this example would look as follows:
Number | Frequency |
|---|---|
-5 | 3 |
2 | 1 |
3.1 | 2 |
7 | 1 |
Thus, we can visualize the dataset's distribution by viewing each value's count through this table generated by the frequency distribution table calculator. The stem-and-leaf plot is another visualization technique for getting insights into the data distribution.
You may also be interested in knowing how to find the mean of the frequency distribution. To extend on this, you could also find the standard deviation of a frequency distribution to gain more insights from it.
How do we calculate cumulative frequency?
To find the cumulative frequency distribution, we need to add the current number's frequency with the frequency of the numbers before it.
So for the same dataset shown above, this is how the cumulative frequency table would look like:
Number | Frequency | Cumulative Frequency |
|---|---|---|
-5 | 3 | 3 |
2 | 1 | 4 |
3.1 | 2 | 6 |
7 | 1 | 7 |
In this manner, we can construct the cumulative frequency distribution for the given data, and if needed, we can also find the relative frequency of each value in the given dataset.
How do we find frequency distribution with grouped data?
Now that we know what frequency distribution is, it's time to extend that to understand grouped frequency distribution! This is very similar to ungrouped frequency distribution. The only difference here is that each bucket corresponds to a range of values, instead of a single value. This range will be uniform across all buckets in the distribution.
To understand this better, let's consider the following dataset with 7 numbers:
-5, 1, 3.1, -5, 3.1, 7, -5
To understand how to make the frequency distribution table for grouped data, let's assume the starting value as -5 and the interval size as 3. This means values from -5 to -2 will fall into the first bucket, -2 to 1 will fall into the second bucket, and so on.
The grouped frequency distribution table calculator will show the following output for the above dataset:
Range | Frequency |
|---|---|
-5 to -2 | 3 |
-2 to 1 | 1 |
1 to 4 | 2 |
4 to 7 | 1 |
Notice that the boundary value 1 in our dataset will count towards the second bucket where its value is the upper limit (-2 to 1) and not in the third bucket where its value is the lower limit (1 to 4).
Frequency distribution chart
If we convert the frequency distribution table to a graphical form, we get a frequency distribution chart. The most common graphical form to represent frequency distribution is the bar chart, where each bar represents the count of the corresponding value in the dataset. At times, for a continuous dataset, a histogram is also used.
The frequency distribution calculator displays the distribution both in table form and in chart form. For example, when we input the 7 sample values shown earlier, we'd get the following chart, in addition to the frequency table:
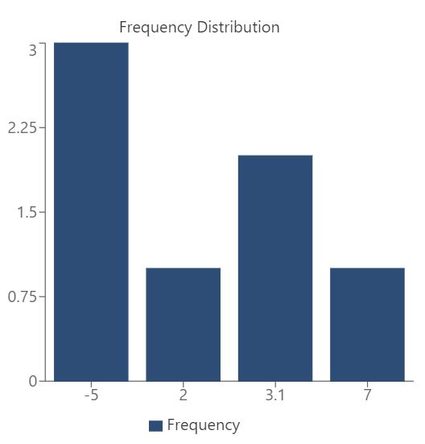
The chart also helps us visualize if our dataset follows a specific type of distribution, such as:
How do we use the frequency distribution calculator?
To use this calculator, all you need is a set of numbers!
- Select the number of values in your dataset using the sample size field, then enter all the numbers. You can input up to 50 values.
- The calculator will automatically show you the frequency table along with cumulative frequency distribution.
- You can switch between the bar charts of frequency distribution or cumulative frequency distribution.
- If you'd like to view grouped frequency distribution, you'd also need to enter the starting value and the group size for each bucket. You'll be able to see the corresponding grouped frequency distribution and the bar chart.
Frequency statistics
You may also be interested in knowing how to find the midpoint of the frequency distribution and many other such statistical parameters. To illustrate, let's continue with our initial set of 7 numbers:
-
-5, 2, 3.1, -5, 3.1, 7, -5 -
To find the mode, we just need to find the most repeated value in this dataset, and ta-da! The frequency distribution table already shows us that -5 is the value with the greatest frequency, so that will be our mode!
-
The median is the middle value in the dataset, when it's arranged in ascending or descending order. The 7 values written in ascending order will read:
-5, -5, -5, 2, 3.1, 3.1, 7
Here we can see that the value at the center is 2, which will be our median!
-
The mean of this dataset is the average of all numbers, which is the sum divided by the count of numbers. So here, since the sum of values is 0.2, the mean will be
0.2/7, and we'll finally get the mean as ~0.02857 -
Standard deviation is a measure of how far apart the data points are, from the mean. For this dataset, the standard deviation will be
4.59, which shows the values are quite widely spread from the mean value of0.02857 -
Additionally, if the standard deviation is large, the variance will also be large since it's the square of the standard deviation. For this dataset, we'll get the variance as
21.07.
FAQs
What is a frequency distribution?
A frequency distribution shows the count of each value in a given set of numbers. These counts for the numbers are most commonly shown as a table or as a bar graph and give us visual insights into how our data is distributed across these values.
What is cumulative frequency?
Cumulative frequency represents the number of observations of a particular value and values below it. So, in essence, it represents the total number of values up to and including the current value.
How do we interpret a bar chart?
Each bar in a bar chart represents a particular value. The height of the bar represents the number of occurrences of that value. This will help us visualize which values are the most frequent and which ones are the least frequent in our dataset.
How do I find the mean for the frequency distribution?
To find the mean of the frequency distribution, here's what we need to do:
- Add up all the values in the given dataset to get the sum.
- Find the number of values in the dataset.
- Divide the sum by the number of values to get the mean of all the numbers!