Thanks to Omni's graphing quadratic inequalities calculator, you will beat your homework assignment in no time! We will teach you how to solve quadratic inequalities by graphing parabolas and how it can help you avoid using the dreaded quadratic formula. Let's go!
🙋 However, in case you want to have a look, we do have a dedicated quadratic formula calculator!
What are quadratic inequalities?
A quadratic inequality is an expression that involves a quadratic trinomial (so a polynomial of degree 2), which we compare to some other expression, most often to number zero. For instance:
ax² + bx + c > 0
Of course, other inequality signs ≥, ≤, or < are also possible.
🙋 To learn more about various aspects of quadratic equations, make sure to visit our factoring trinomials calculator.
How do I solve quadratic inequalities by graphing?
To solve a quadratic inequality ax² + bx + c > d:
- Draw the line
y = d. - Determine the points where the parabola
ax² + bx + ccrosses/touches this line. To find them, solveax² + bx + (c - d) = 0. If there's no solution, your parabola is entirely above or below the line. - Graph the parabola, taking into account the results from Step 2:
- The arms go upwards if
a > 0. - The arms go downwards if
a < 0.
- The arms go upwards if
- Because our inequality features the
>sign, we check where the parabola is strictly above the line.
How to use this graphing quadratic inequalities calculator
Nothing can be easier than using Omni's graphing quadratic inequalities calculator! Here's a brief instruction:
- Input the coefficients of your quadratic inequality into their fields.
- Make sure to adjust the inequality sign to your needs.
- The results appear immediately at the bottom of our graphing quadratic inequalities calculator!
- Our tool gives the results in terms of a graph and also as an interval.
- You may use our inequality to interval notation calculator to rewrite the solution as inequalities.
You see? As promised, with our tool bookmarked, you'll never again struggle with the question of how to graph quadratic inequalities!
Examples of graphing quadratic inequalities
In this final section, we include some examples of graphing solutions to quadratic inequalities so that you can verify if you already understand perfectly well how to graph quadratic inequalities.
Example 1.
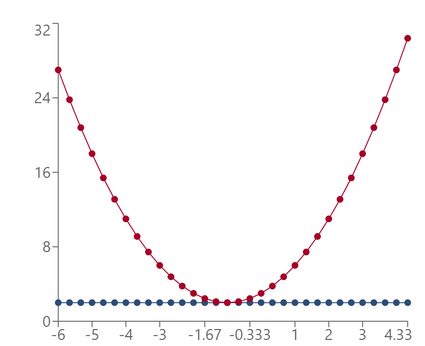
Let's discuss how to graph the quadratic inequality -x² + 3x - 2 ≥ 0.
First, we draw the line y = 0. Obviously, it coincides with the horizontal axis. Let's move on to the parabola. Since a = -1, we see the parabola will have its arms pointing downwards. We need to solve
-x² + 3x - 2 = 0,
to determine where it crosses the horizontal axis. Using one of the many methods of solving quadratic equations, we find that x = 1 or x = 2.
Since we have the ≥ sign, we're interested in points where the parabola is above or precisely at the axis. It is now easy to conclude that our inequality is satisfied when 1 ≤ x ≤ 2, or, in interval notation, x ∊ [1, 2].

Example 2.
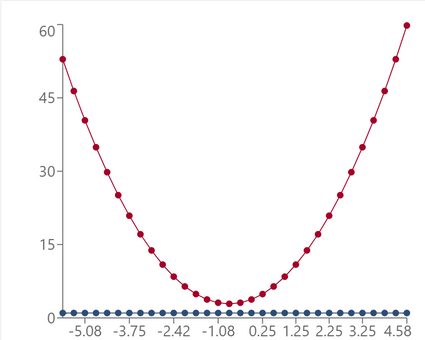
Let's graph the quadratic inequality:
x² + 2x + 3 > 2
As before, we draw the horizontal line corresponding to the right-hand side of our inequality: y = 2. We see that we have a > 0 in our quadratic trinomial, so the arms will go upward. To determine precisely where the parabola crosses the line, we need to solve the equation:
x² + 2x + 3 = 2.
Adding -2 to both sides, we get:
x² + 2x + 1 = 0
We recognize a perfect square trinomial! We can further transform it via the short multiplication formula to:
(x + 1)² = 0
So,
x + 1 = 0
And, finally, we get:
x = -1
Therefore, the parabola does not cross the line but touches it (and gently!) at x = -1. Since we deal with the inequality
x² + 2x + 3 > 2,
we're looking for arguments where the parabola is strictly above the line. Hence, our inequality is satisfied for each argument x apart from the one where the parabola touches the line, so for x ∊ ℝ \ {-1}.
Example 3.
Finally, we discuss how to solve 2x² + 3x + 4 < 1 by graphing.
First, of course, we draw the horizontal line y = 1. Next, we solve
2x² + 3x + 4 = 1.
So, adding -1 to both sides, we get:
2x² + 3x + 3 = 0.
We start applying the quadratic formula:
Δ = 3² - 4 × 3 × 3 = 9 - 12 = -3.
Since the discriminant Δ is negative, we know the equation in question has no (real) solutions, and so our parabola does not cross/touch the horizontal line. Since this parabola points upwards (a = 2), it follows that it lies entirely above the line. And our inequality asks for points where the parabola is strictly below the line ('<' sign). We conclude that there are no solutions: x ∊ ∅.
You can use the graphing quadratic inequalities calculator to go through all of these examples, as well as generate your own. Remember that practice makes perfect!
FAQs
How do I graph solutions to quadratic inequalities?
You can graph solutions to quadratic inequalities as intervals or unions of (at most two) intervals on the number line. This method is very similar to graphing absolute value inequalities. However, to precisely find the boundary points of the intervals, you will have to solve a quadratic equation, using, e.g., the quadratic formula.
How do I graph the system of quadratic inequalities?
To graph the system of quadratic inequalities, you need to carefully graph these inequalities one-by-one on a common plot, and then find all the arguments where all the inequalities are satisfied.
How do I solve x² < 1 by graphing?
- Draw the parabola
y = x²: it touches the horizontal axis atx = 0, and its arms go upwards. - Draw the horizontal line
y = 1. - Find where the parabola is strictly below the line: for
-1 < x < 1. - That's it! Your inequality holds for
x ∊ (-1, 1), and you solved it by graphing!