If you want to understand how an epidemic, like the flu or , evolves over time, and how we can minimize its effects, this infectious disease and epidemic calculator will help you fulfill that goal.
Using the SIR model, you can simulate any viral infection you want, from an influenza (like the Spanish flu) to measles or smallpox. As a result, you can see the number of infected and recovered people at any time. To learn more about the basic reproduction number and whether a virus is a pandemic vs. epidemic, keep reading and create your own scenarios!
What is the infectious disease and epidemic calculator?
This Infectious disease and epidemic calculator is a simple device that allows you to simulate the evolution of any infection over time. From a set of initial conditions, the calculator will simulate and show you how the infection spreads across the population.

You can model any infection you'd like, you just need to provide the parameters. So, it doesn't matter if we're talking about coronavirus (SARS-CoV-2), Measles, AIDS, influenza, or the seasonal flu; the evolution of the epidemic will follow the same rules. Since these rules are very complicated when we look at details, it is necessary to take a step back and look at the big picture. From here, we can use the simple mathematical model, SIR, to represent, with reasonable accuracy, the behavior of an infectious disease.
How to simulate an infection epidemic (SIR model and more)?
The model that predicts the spread of an infectious disease. It is an idealization of the real situation, so some assumptions are made. There are a few free parameters that can be adjusted to better represent a specific disease, or a given action meant to control a disease.
The acronym SIR stands for Susceptible, Infected, and Recovered. These are the three groups into which we divide the population. A different equation describes the evolution of each group. Susceptible people are those who have not suffered the disease yet, and are not immune to it. The infected ones are those currently undergoing the viral process or disease (and therefore, are able to infect other people). And lastly, recovered includes everyone that cannot be infected due to innate immunity, immunity after contracting the disease, and those who unfortunately died during to outbreak (which is why we sometimes use removed instead of recovered).
The SIR model is based on the dynamics of each group, generally presented as differential equations. For simplicity, we have opted to offer the equivalent iterative version of this model, in which we define the state of each group at a time t + Δt as a function of their state at a previous time t, where Δt is typically very small.
Using this formulation, the population of each group evolves over time in the following fashion:
- S(t + Δt) = S(t) - Δt × S(t) × I(t) × β / N,
- I(t + Δt) = I(t) + Δt × [β × S(t) × I(t) / N - 𝛾 × I(t)],
- R(t + Δt) = R(t) + Δt × 𝛾 × I(t),
where N = S + I + R is the total population, 𝛾 is the inverse of the typical recovery time, and β is the inverse of the mean time between infectious contacts.
An essential parameter of the SIR model is the basic reproduction number of the disease, also called R₀. You can understand R₀ as the average number of people that someone with the disease will infect before he/she recovers. When R₀ > 1, the disease will spread, infecting an increasing amount of people. For R₀ < 1, the number of infected people gets reduced, and the infection of the virus doesn't spread very far.
We use this parameter to quickly distinguish between infections. Measles is very infectious, R₀ = 12-18, while influenza typically spreads slowly, R₀ = 0.9-2.1. You probably notice that R₀ is given as a range in many cases. That is because measuring this parameter in real life is very complicated as countless factors affect its value.
How to use the Infectious disease and epidemic calculator?
The most straightforward use of this Infectious disease and epidemic calculator is to understand the evolution of a viral infection or any contagious disease. You can choose from a list of preset parameters, or you can even play with your own scenarios.
To get a simulation, simply follow these steps:
- Input the population of the region you want to simulate (use
1if you want percentages to be calculated); - Input the percentage of Susceptible, Infected, and Immune (Recovered) people in your population. You can use simple equations as well (see pro-tips below);
- Set the values of your disease/viral infection. You can choose from our preset or input your own values manually (select 'Other infection'). In the latter, enter two of the three parameters, and the third will be calculated automatically;
- Select how far into the future you want to simulate the dynamics of the disease.
Pro-tip:
- If you only know the number of Susceptible, Infected, or Recovered people, you can use the percentage calculator to get their percentages. You can also input mathematical equations in the calculator fields. For example, if you know the number of infected is 5 000 and total population is 1 000 000, use an equation like this for calculating the percentage of infected people:
100 × number of infected/total population, i.e.,100 × 5000/1000000.
SARS-CoV-2, influenza... pandemics vs epidemics
A pandemic is an epidemic that has affected a vast region or infected a large number of people. So, a pandemic is any epidemic that has large-scale effects, and it is the World Health Organization (WHO) that decides if an infection or virus is a pandemic.
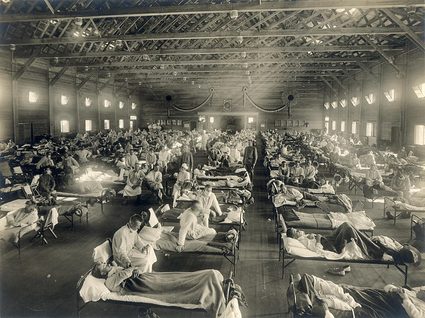
Across history, humanity has suffered uncountable epidemics and several notable pandemics. Viruses and diseases such as cholera, typhus, smallpox, influenza, and even measles have caused pandemics due to their effects on humanity.
Currently, both the SARS-CoV-2 virus and AIDS are declared pandemics, and have not yet been eradicated or brought down to epidemic levels. The SARS-CoV-2, commonly known as coronavirus, is the latest pandemic. It severely affects those with lung and respiratory problems, as well as preexisting heart diseases. For checking the risk of developing severe cardiovascular complications, use the CVD risk calculator.
AIDS/HIV has been with us for longer, and it's an example of a pandemic that is mostly controlled in the developed world, thanks to preventive methods and proper medical treatment. It is still a great concern in other parts of the world, where a lack of education on the topic and poor healthcare systems means that these infections still cause numerous deaths.
A common feature that these two infections share is the fact that there is no available vaccine to immunize the population. This raises the number of susceptible individuals and increases the rate of infection, as well as the number of patients.
So, long story short, the difference between a pandemic vs. an epidemic is the size of the population the disease affects.
Fighting the infection
You might be asking yourself, "Is there any way we could lessen the effect of infections, or are we doomed?" The answer is that we do have many ways to fight back.
By far, the most effective method we know of is vaccination. Proper vaccination calendars can literally eradicate infections from Earth. It also creates a sort of "herd immunity" that protects those who cannot be vaccinated for medical reasons. You can test this scenario by setting the "Immune" field to 95% or higher and seeing how that affects the simulation.
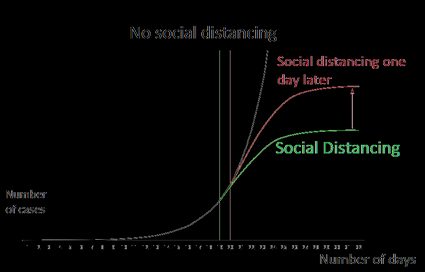
Short of vaccination, the second-best attack plan we have is isolation and confinement. Due to the exponential growth that characterizes an infection, isolating as many cases as possible as soon as possible will stunt its growth. During total isolation, the virus cannot propagate to other humans, and, with proper care and treatment of the patient, we can maximize their chances of survival.
To simulate isolation using a SIR model, you can reduce the effective value of R₀, as isolation decreases the mean time between infections. Ideal isolation can reduce R₀ to close to 0, but anything lower than 1 ensures success in stopping the infection in the long run. The level of isolation affects the value of R₀, and so do our social contact habits. Things like disinfecting your hands regularly, not touching your face, or keeping at least six feet (two meters) distance between you and others will also decrease the effective value of R₀.
Want to learn more about health behaviors such as social distancing? Then check the Omni social distancing calculator!
Limitations of the SIR model
The SIR model is a very reliable representation of the general evolution of an epidemic, and it is mathematically simple. The result is that we need to make some assumptions, and there are certain scenarios for which it might not be well suited. The SIR model assumes life-long immunity to the virus (which is not always true), and it assumes no natural deaths or births (which is only reasonable for small populations or for short periods of time).
Lastly, the SIR model presented here is based on a fixed value of R₀, which means that it does not take into account behavioral changes in the population. Things like social distancing, stricter hygiene protocol, or the use of face masks are common changes when a viral outbreak happens, and they will work to lower the value of R₀ and slow down the spread of the disease.