The working capital calculator is a fantastic tool that allows you to get the surplus between a company's current assets and its current liabilities. In this article, we will define what working capital is, how to calculate it by using the working capital formula, what it says to management, and what happens if working capital changes drastically. We will also explore the working capital turnover ratio and review a real company example: Alibaba.
What is working capital?
Working capital, also known as net working capital (NWC), is a financial liquidity indicator that shows the difference between current assets and current liabilities.
-
Current assets (CA) represent all that a company has in cash or can be converted into cash in less than 12 months. The former is cash, cash equivalents, inventories, and accounts receivables. The latter represents all client's debts to the company for already delivered products or services provided.
-
Current liabilities (CL) include all the financial/operating debt that the business has. It can be interest-bearing debt such as the current portion of the long-term debt (financial) or non-interest bearing like accounts payable (operating).
-
Working capital, together with long-term assets equal to the capital employed. Both represent the total amount of money invested in a company that can be used for producing an operating profit.
Thereby, here we have our first formula:
What is the working capital formula?
Working capital is sometimes considered the operating money needed to sustain operations, although individual variations like the dividends or accruals might confuse that definition. Thus, in this article, we will differentiate between net working capital and non-cash working capital, which is treated more extensively in the cash conversion cycle calculator. The net working capital formula goes as follows:
As mentioned before, we look for a positive NWC. Moreover, there is another liquidity relation worth mentioning here: the working capital ratio.
What does working capital tell management?
A positive working capital shows a well-positioned company where its current assets can cover all the current liabilities. It also positions the company for conducting further expansion investments. On the other hand, a much bigger net working capital than similar companies might indicate a lack of room for growth. That's not good either.
A way to associate the amount of working capital to the actual operations' performance is to relate it to the sales generated. The idea is to see how much sales the company produces, given a specific working capital. For that purpose, we use the working capital turnover ratio.
How to calculate the working capital turnover ratio?
Because here we will include the revenues for a specific period, it is essential to get the change in working capital rather than an instant picture like the information shown in the balance sheet.
Consequently, we have to use an average NWC calculated considering the beginning and end of the analysis period. The working capital turnover ratio formula is:
where and refers to beginning and the end of the financial period, respectively.
Investors who review the working capital management from a turnover point of view can track this efficiency ratio trend and determine if the company is using better or worse its NWC.
Is the change in working capital relevant to investors?
An increasing working capital might sound all good; however, it can reveal a few operational problems. Let's check some reasons for a positive change in working capital:
-
Foremost, we have to check cash. A change in working capital can be related directly to a change in cash. You could verify it in the operating cash flow calculator. However, although an increase in cash is beneficial, too much could also be considered an opportunity cost. The company should give back excess cash to investors in terms of stock buybacks or dividends.
-
Inventory financial accounts might be increasing, which can mean less stock rotation. Here we recommend you to also check the inventory turnover ratio calculator.
-
Accounts receivables might be increasing, which means the company is giving more credits to its customers. On the liability side, accounts payable might be decreasing because of faster payment to suppliers. We suggest you check the cash conversion cycle article mentioned above.
But, what if the change in working capital ends up reducing it? There we can be facing another situation where current liabilities are just covered.
It can sound great because working capital turnover would indicate top efficiency; however, an unexpected increase in accounts payable or a cash emergency reduction could make the company have negative working capital or non-financially insolvent.
Net working capital and working capital ratio example
This section will explore the financial statement of one of the biggest Chinese companies: Alibaba. , as listed on The New York Stock Exchange, is an online retail company that allows people to import goods from China to the rest of the world and has been experiencing incredible growth during 2020 because of the pandemic lockdown.
First, we need to go to the . The information we need is:
, and
.
Then, by using the working capital calculator, we obtain:
.
Working capital turnover ratio example
To see working capital management efficiency without any seasonality effect, we will consider the 2020 Alibaba yearly report again.
Balance sheet:
.
Income statement:
By using our smart working capital calculator, we get:
Furthermore, if we take into consideration the last five years of Alibaba yearly reports, and we use our working capital calculator, we get the following chart:
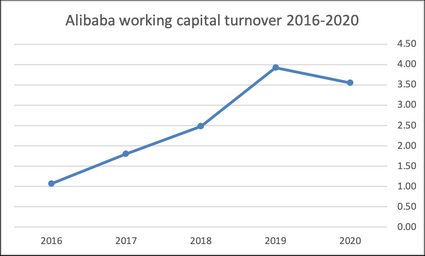
It is interesting to see that the working capital management efficiency has grown year over year but more impressive is that Alibaba operating cash flow had a compound annual growth rate of 30.44% during the last five years.
As a consequence of operating cash flow and EBIT increase, market capitalization has grown too, making Alibaba have a total return on investment of approximately 180%, or 36% per year.