Welcome to the Omni upper control limit calculator aka UCL calculator! A simple tool for when you want to calculate the upper control limit of your process dataset. The upper and lower control limits are critical indicators to help you determine whether variation in your process is stable and caused by an expected source.
If you read further, you can learn what control limits and control charts are, how to calculate the upper control limit and implement it in real life. To better understand the concept, we have prepared an example for you as well. Come along! 👩🏻🏫
What are control limits?
Control limits are used to detect whether the variation in a process we observe is within the expected limits. More specifically, control limits help us see whether the observed variation in the process of interest is due to random or special causes. Any variation detected inside the control limits probably occurred by chance. On the other hand, variation outside of the control limits likely occurred due to special causes.
The upper control limit (UCL) and the lower control limit (LCL) serve as boundaries for expected deviation in data.
Sounds complicated? Here is an example:
- Let’s say your bakery takes 40 minutes on average to bake bread 🍞. Due to random causes, sometimes the baking process takes 46 minutes, but sometimes 34 minutes is enough. Because this variation in time is due to common causes, it is within statistical control. However, if your oven breaks down and bread baking takes one hour, the variation in time is caused by a particular cause (e.g., oven malfunctioning).
💡 Want to find the lower fence and the upper fence of your data? Visit Omni upper and lower fence calculator.
How do you calculate upper control limit (UCL)?
To calculate the control limits of your process dataset, follow these steps:
- Calculate the mean
x. - Calculate the standard deviation
σof the dataset. - Multiply the standard deviation by the control limit
L(dispersion of sigma lines from the control mean) and:- Add this number to the mean to find the upper control limit
UCL = x - (-L × σ); or - Subtract this number from the mean to obtain the lower control limit
LCL = x - (L × σ).
- Add this number to the mean to find the upper control limit
Note: although the control limit you wish to evaluate could be any number, we set our calculator's default control limit as three-sigmas since it is most commonly utilized. Feel free to change it if you want to try out different control limits. And if you're curious to learn more about the three-sigma rule, check Omni empirical rule calculator 🧠.
Now that you know how to calculate the upper control limit, let's talk about the use of control limits.
What is the use of control limits?
Control limits are usually utilized by Six Sigma practitioners as a statistical quality control for detecting whether variations in the production process of interest are out of control (not stable). To do such statistical process monitoring, we look at control charts. If the control chart indicates that the process is out of control and variation is above the upper and lower control limits, analyzing the chart can help determine the particular cause of this variation.
If you're also interested in your process's capability to produce results relative to customer requirements, check process capability index calculator.
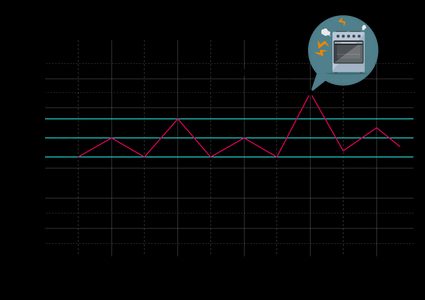
Remember the bakery example? 👨🏻🍳
Suppose you used our control limit calculator and determined that the upper control limit for breaking bread is 46 minutes 🕐. If the oven is not working correctly and takes one hour to bake bread instead of 40 minutes (average time of baking), the control chart of the process will display unexpected variations. In this case, data at some point in time will appear well above the upper control limit; therefore, as a bakery owner, you can assume that process performance is degraded because of the particular cause, e.g., malfunctioning oven, rather than random causes.
FAQs
What is usually the value of the control limit?
±3. A ±3 control limit means that the upper and lower control limit will differ by ±3 standard deviations from the mean. In a normal distribution, 99.73% of all values will fall within this range, with only about 0.27% of the data expected to fall outside the control limits.