Calculating the standard deviation of the sample mean (aka standard deviation of the sampling distribution of the mean) is an excellent way to make sense of how the sample size influences the error of our estimates.
When the standard deviation of the mean is multiplied by a critical value, like the z-score or t-statistic, we obtain a margin of error that allows stating a confidence interval of our prediction. Therefore, calculating the standard deviation of the sampling distribution of the mean indicates where the population mean could be.
🔎 After calculating the standard deviation of the distribution of sample means, you can go one step beyond and use our normal probability calculator for sampling distributions.
What is the standard deviation of the distribution of the sample mean?
First of all, it's important to clarify that this term is known by various names such as:
- The standard deviation of the mean;
- The standard deviation of the sample mean;
- The standard deviation of the distribution of sample means; and
- The standard deviation of the sampling distribution of the sample mean.
It's also essential to know some definitions and concepts:
- Statistic: a point estimate or numeric characteristic of a sample (i.e., sample mean). It's different from a parameter, such as the population mean.
- Sampling distribution: the probability distribution of a randomly sampled statistic. In other words, it is the distribution of all the possible values that a statistic could take using the same sample size.
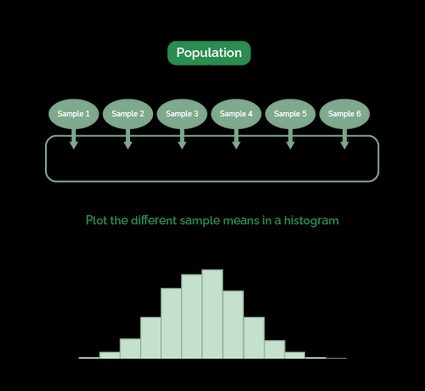
- Sampling distribution of the mean: this is an extension of the previous concept. If you have a population, take infinite samples of n size, and plot their means in a histogram, you get a probability distribution. That probability distribution is what we call the sampling distribution of the mean, and like any other distribution, it has its own mean and standard deviation.
The following diagram shows how to generate a sampling distribution of the mean. In reality, we don't use only six samples but an almost infinite number (i.e., 100,000).
That said, we can define the standard deviation mean as the standard deviation of a distribution of means (like the one shown in the last diagram). Additionally, the mean of this sampling distribution is equal to the population mean.
Now that you know the concept, let's see how to calculate the standard deviation of the sample mean.
What is the difference between sample distribution and sampling distribution?
The difference between a sample and sampling distribution is:
- Sampling distribution: it's the term we usually hear. It refers to the probability distribution of a randomly sampled statistic. The sampling distribution of the mean is an example.
- Sample distribution: accounts for the distribution of the observations within only one sample. Each sample distribution possesses a mean, which helps form the sampling distribution.
How to calculate the standard deviation of the sample mean?
The formula to find the standard deviation of the sample mean is:
σX̄ = σ/√n
where:
- σX̄ – Standard deviation of the sample mean;
- σ – Population standard deviation; and
- n - Sample size.
We previously said that if we know the mean of the sampling distribution (μX̄), we also know the population mean (μ), as they're equal (μX̄ = μ). In practice, we never know μX̄, but we can estimate it using the sample mean (X̄).
σX̄ indicates how X̄ approximates μ. The smaller σX̄, the nearest μ can be from our estimate. As σ is constant, increasing the sample size is the only way to diminish σX̄. Therefore, increasing n is a way to reduce our estimations' sampling error.
Example of how to find the standard deviation of the sample mean (with this calculator)
We know that the mean and standard deviation of the height of the adult American female population is about μ = 161.3 cm and σ = 7.1 cm. Now, suppose you randomly take samples of 100 women and take their mean height each time. What is the standard deviation of the sample mean?
To know the answer, follow these steps:
- Input 7.1 in the population standard deviation box.
- Input 100 in the sample size box.
- That's it. The answer should be 0.71. Therefore, the standard deviation of the sampling distributions of means n = 100 is 0.71.
You can check the results using the formula:
FAQs
How do I find the mean and standard deviation of the sampling distribution?
- To find the standard deviation of the sample mean (σX̄), divide the population standard deviation (σ) by the square root of the sample size (n): σX̄ = σ/√n.
- Contrary to the standard deviation, to calculate the mean of the sampling distribution of the mean (μX̄), you only need the population mean (μ), as they are both the same (μX̄ = μ).
What is the standard deviation of the sample means called?
The standard deviation of the sample means is called by different names:
- The standard deviation of the mean.
- The standard deviation of the distribution of sample means.
- The standard deviation of the sampling distribution of the sample mean.
Mathematically, you calculate the standard deviation of the sample mean with the formula σX̄ = σ/√n.
The standard error of the mean (SE(X̄)) is a different statistic that uses the sample standard deviation (s) instead of σ. Its formula is SE(X̄) = s/√n.
How to create a sampling distribution of the mean?
Follow these steps to create a sampling distribution of the mean:
- Define a sample size.
- Take a random sample of that size and calculate its mean.
- Plot that mean in a histogram.
- Repeat this process an almost infinite number of times (i.e., 100,000 times) until the distribution converges.
What does a standard deviation of 1 mean?
If we're in front of a normal distribution, a standard deviation of 1 (σ = 1) means that 68.27% of the distribution values lie within one standard deviation from the mean. In mathematical notation: Pr( μ-1σ ≤ X ≤ μ+1σ) ≈ 68.27%.