Give a probability , select the tail area, specify the mean () and standard deviation () for the continuous random variable and our inverse normal distribution calculator will find the corresponding x-value.
In short, the inverse normal distribution works backward to find the value of x from a known probability. Our invnorm calculator will also give you the Z-score for the given area below x, above x, between x1 and x2, and outside x1 and x2.
In this article, you will learn more about the following:
- How to use the invnorm calculator; and
- When to use the invnorm distribution function.
You will also find a concrete example of how to use the inverse normal distribution calculator with steps.
If you're still wondering: What does invnorm find? Read on!
Inverse normal calculator: what is the inverse normal distribution?
The inverse normal function calculates the inverse of the cumulative distribution function (CDF) of a normal distribution. To learn more about the normal CDF, check out our normal distribution calculator. Here's the normal cumulative distribution function:
From the equation above, we can now define the normal inverse distribution function . If is strictly increasing and continuous then , with is the unique real number such that .
Thus, given a probability that corresponds to the area under a bell curve, the inverse normal distribution calculator will help you determine:
- The value of for which , a continuous random variable, must be less than or equal to, so that:
- The value of for which must be greater than, so that :
- The value of such that the total probability outside the interval , with the mean, is equal to , i.e., :
- The value of such that the total probability within the interval is equal to , i.e., :
When to use invnorm: Normal distribution vs. inverse normal distribution
In this section, you will find the main differences between the normal distribution and the inverse normal distribution.
Normal distribution
The normal distribution function allows you to find the area under the curve and determine the probability of a value being greater or less than a random value. The area under the curve represents:
- The probability that one observation falls in a given range; or
- The percentage of all observations that fall in the given range.
Inverse normal distribution
The inverse normal function or is similar, but is used when you already know the area under the curve. It tells you the value of x for when is given. is a continuous random variable that follows a normal distribution.
In short, the normal distribution calculates the probabilities associated with values, while the inverse normal distribution calculates the values associated with given probabilities.
If you want to know more about the inverse normal function, check out our IQ example. We will show you how to use the inverse normal calculator with a concrete example.
Inverse normal distribution calculator: How to use the invnorm calculator
The inverse normal CDF calculator helps you determine the x-value and the Z-score associated with the given probability . Here's how to use the inverse normal distribution calculator:
-
Input the probability : it must be a number between 0 and 1.
-
Select the tail area:
-
: This option calculates the value of below which the probability is .
-
: This option calculates the value of above which the probability is .
-
: This option calculates the value of on either side of the mean that leaves the total probability of outside the interval .
-
: This option calculates the value of on either side of the mean that encompasses the total probability of within the interval .
If you need help switching from inequality notation to interval notation and vice versa, take a look at our interval notation calculator.
-
-
Enter the mean : It is the average value of the data set that conforms to the normal distribution.
-
Enter the standard deviation : The value quantifies the variation or dispersion of the data set to be evaluated. Sometimes, you will be given the variance instead of the standard deviation. Remember, then, that the standard deviation is equal to the square root of the variance.
-
Our invnorm calculator gives you the following results:
-
x-value: The specific value you were looking for based on the chosen tail area.
-
Z-score: The corresponding Z-score, which is the number of standard deviations away from the mean.
-
Congrats! Now you know how to calculate the inverse normal distribution x-value.
A note on the Z-score:
The normal random variable of a standard normal distribution is called a standard score or a Z-score. The normal random variable from any normal distribution can be transformed into a Z-score from a standard normal distribution via the following equation:
A Z-score may be positive or negative. If it is positive, the score will be above the mean; if it is negative, it will be below the mean. You can learn more on the subject with our Z-score calculator.
You can use our inverse normal CDF calculator as an inverse standard normal distribution calculator. If you input the mean, , as 0 and the standard deviation, , as 1, the Z-score will be equal to x.
Inverse normal calculator: an IQ score example
Let's take a concrete example to show you how to use our inverse normal distribution calculator with steps.
IQ scores are found to be normally distributed, with a mean and a standard deviation .
This example aims to find the x-values for the four different cases using the invnorm calculator.
-
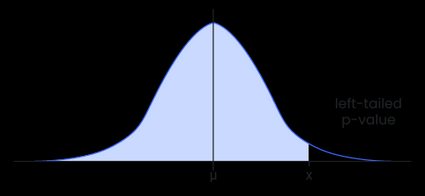
Left-tailed p-value
What IQ score does a person need to be to fall in the bottom of the population?
Mathematically, this means finding the value of for which the probability of obtaining an IQ lower than is .
Using the calculator, you must:
-
Enter for .
-
Select .
-
Input 100 for the mean and 15 for the standard deviation .
-
Here are your results: with the corresponding Z-score of .
Therefore, if a person has an IQ score of or less, they are in the bottom of the population.
-
-
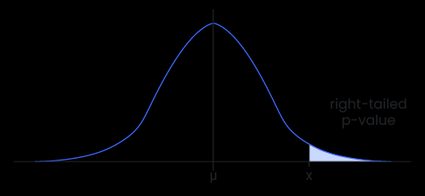
Right-tailed p-value
What IQ score does a person need to be to fall in the top of the population?
Here, we want the probability of obtaining an IQ greater than to be .
Using the calculator, you must:
-
Enter for .
-
Select .
-
Input 100 for the mean and 15 for the standard deviation .
-
You get the following results: with the corresponding Z-score of .
So, an IQ of or more places a person in the top of the population.
-
-
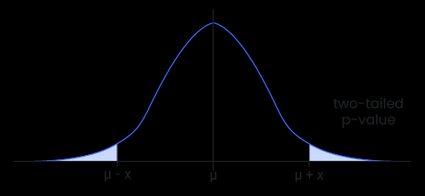
Two-tailed p-value
Now, let's assume that of the population is outside the average range. What are the lowest and highest IQ scores at which an individual is considered outside this range?
We want to find , the upper bound of the left tail, and , the lower bound of the right tail that defines the average range.
Using the calculator, you must:
-
Enter for .
-
Select .
-
Input 100 for the mean and 15 for the standard deviation .
-
Here are your results: and with the corresponding Z-scores of and , respectively.
To be considered outside the range, an individual must have an IQ score lower than or higher than .
-
-
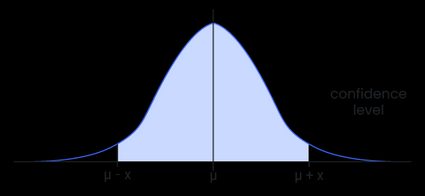
Confidence level
What is the range of IQ scores that represents the middle of the population?
We want to find the lower bound and the upper bound that define the interval .
Using the calculator, you must:
-
Enter for .
-
Select .
-
Input 100 for the mean and 15 for the standard deviation .
-
You get the following results: and with the corresponding Z-scores of and , respectively.
To be considered part of the middle of the population, an individual must have an IQ score between and .
-
FAQs
How do I calculate the Z-score from the x-value?
To calculate the Z-score from the x-value, you need to know the parameter of your distribution, i.e., the mean and the standard deviation. Then:
- Subtract the mean from the x-value.
- Divide the result by the standard deviation.
- That's it!
What is the x-value that keeps 30% of the values on the left?
147.17. Suppose we have a continuous random variable X~N(165, 342) that follows a normal distribution. A value of X must be less than 147.17 to fall into the bottom 30%. We know that the corresponding Z-score is equal to -0.5244. To find x, we solve the following equation:
x = (Z-score × σ) + μ
x = (-0.5244 × 34) + 165
x = 147.17
What does invnorm find?
The inverse normal distribution or invnorm allows you to find the value of x of a normal distribution given a probability p, the mean μ, and the standard deviation σ of the distribution. Simply put, it works backward from the area under the normal distribution curve to find the x-value corresponding to that area.
What are the tails of the normal distribution?
The tails of the normal distribution are the regions farthest from the mean, where the distribution approaches zero. There are two tails, the left and the right tail.
The area under the tails of a distribution correlates with the probability of extreme events.