How Much Time Do People Your Age Spend Alone?
Want more stories like this?
Follow Omni on Google.


Think about yesterday. Between work, meals, chores, and screen time, how much time did you spend with nobody else around?
Using the 2025 American Time Use Survey data, published by the U.S. Bureau of Labor Statistics (BLS), we examined how time alone varies with age, family circumstances, and earnings.
Key Takeaways
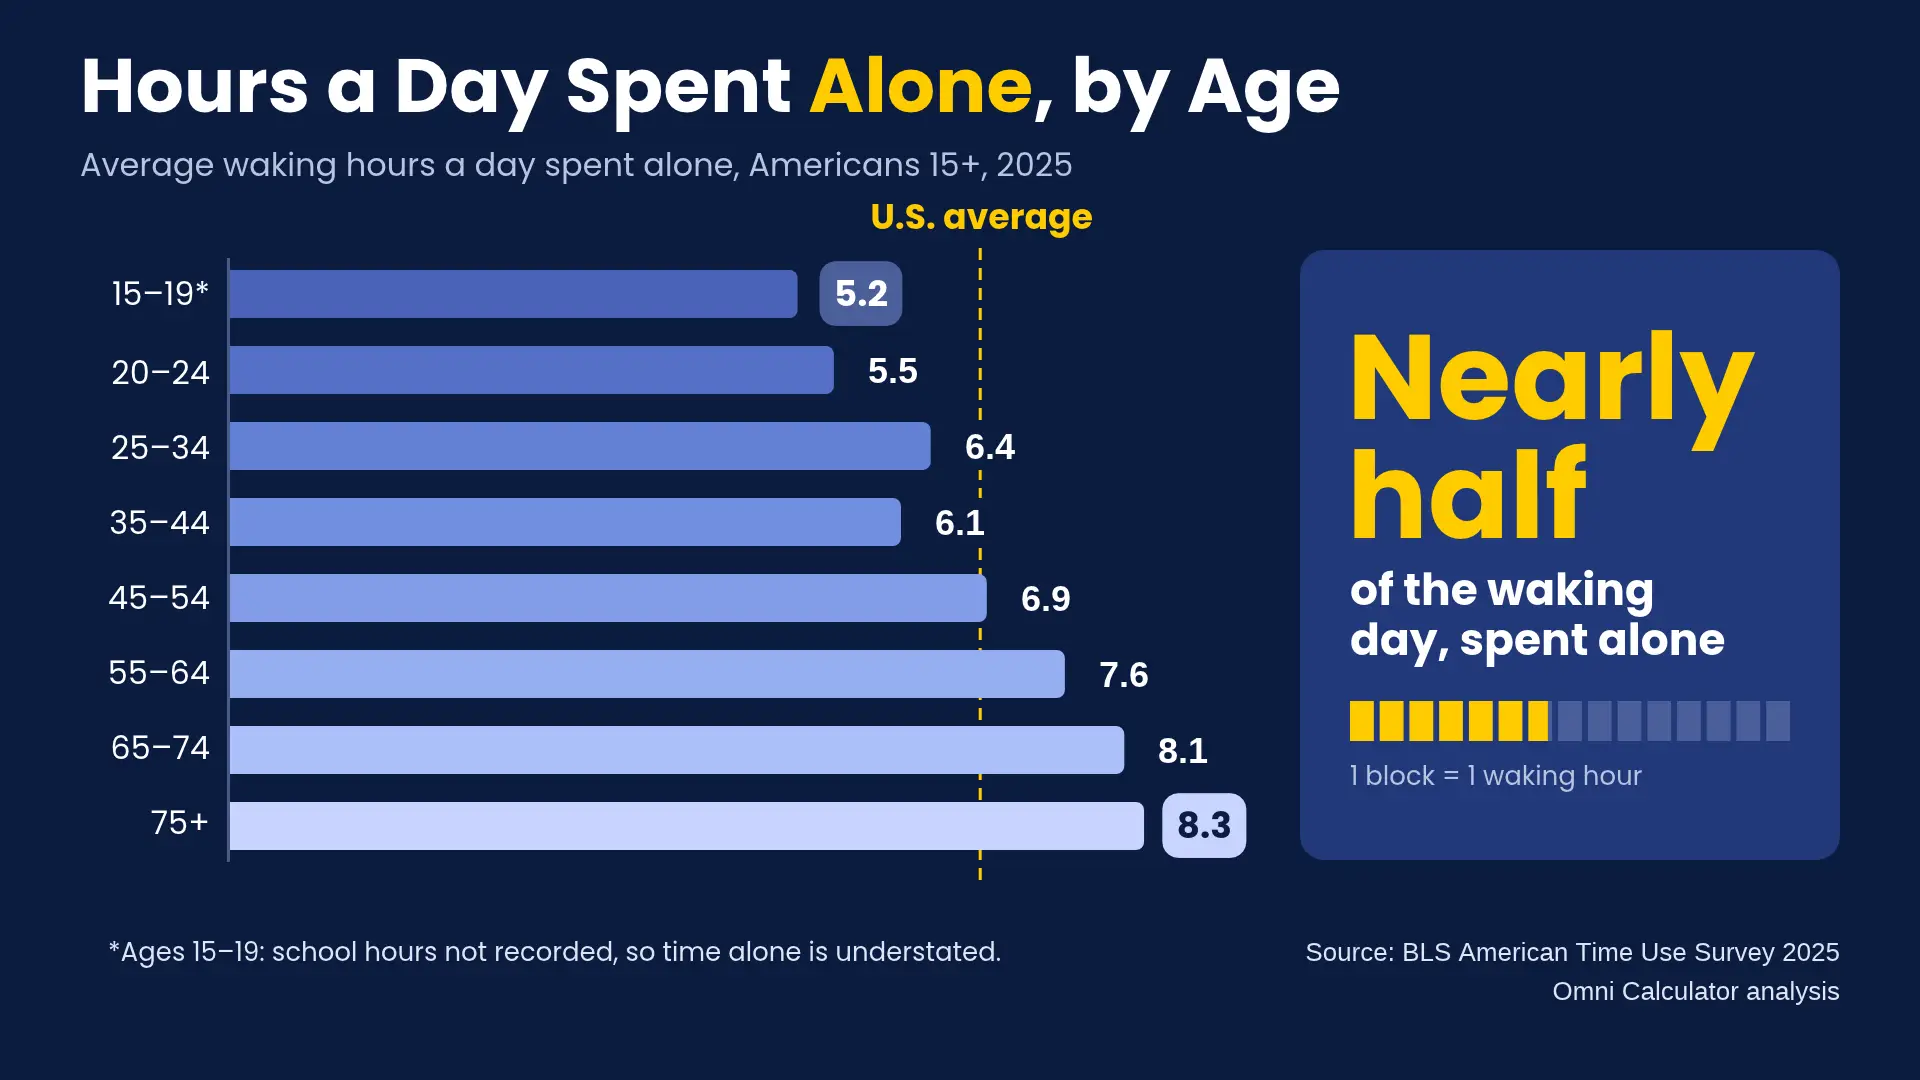
- Americans aged 15 and older spend an average of 6.8 hours alone daily, nearly half (46%) of their waking time.
- Adults aged 75 and older spend 56% of their waking day alone, compared with 39% for those aged 20–24.
- People living with children under six spend 4.3 hours alone daily, compared with 7.7 hours for those without children under 18.
- Among full-time workers with one job, the highest-paid 25% spend the most time alone, averaging 7.7 hours daily.
How much time do Americans spend alone at different ages?
People in their early 20s spend an average of 5.5 hours alone each day. By ages 55-64, that rises to 7.6 hours. Americans aged 75 and older average 8.3 hours alone, nearly three hours more than those aged 20-24.
The oldest Americans also spend more than half their waking day alone. Among people in their early 20s, the share is less than 40%.
Time alone generally rises across age groups, although there is a small dip among people aged 35–44, who average 6.1 hours compared with 6.4 hours for those aged 25–34.
Teenagers aged 15-19 have the lowest recorded figure at 5.2 hours. However, the BLS survey did not record whether they were alone or with others for an average of 2.6 hours each day, including during certain school and personal activities. Their actual time alone could therefore be higher.
Living with young children changes the picture
Having young children at home makes a big difference in how much time people spend alone.
Americans living in households where the youngest child is under six spend an average of 4.3 hours alone each day, just 28% of their waking time. For those living in households without children under 18, the average jumps to 7.7 hours, or 51% of their waking day.
Marriage also appears to affect how much time Americans spend alone. Married Americans living with their spouses spend an average of 5.8 hours alone, while people in other marital categories average 7.8 hours.
The difference between men and women is much smaller. Men average 7.1 hours alone daily, compared with 6.6 hours for women.
The highest-paid workers spend the most time alone
Money doesn't necessarily mean spending more time surrounded by other people.
Among full-time workers with one job, the highest-paid 25% spend more time alone than any other earnings group. They average 7.7 hours alone daily, compared with just 6.1 hours among workers in the second earnings quarter. The difference amounts to roughly 1 hour and 39 minutes per day.
Interestingly, the amount of time alone doesn't increase steadily with earnings. Workers in the lowest-paid quarter average 6.1 hours alone, while those in the third quarter spend 6.7 hours.
Americans spend more time alone on weekdays
On non-holiday weekdays, Americans spend an average of 7.2 hours alone. On weekends and holidays, the figure drops to 6.0 hours. The difference comes out to be about 74 minutes.
The BLS also found that only 30.4% of Americans spent any time socializing face-to-face on an average day in 2025, down from 38.1% in 2015.
It is worth noting that socializing and being around other people aren't the same thing. Someone could spend hours surrounded by coworkers without socializing with them. Likewise, a person talking to friends on the phone could still be physically alone.
Find out how your group compares
The table below shows average daily waking hours and time alone for different groups of Americans in 2025. The final column shows how much of each group's waking day was spent alone.
Time alone by group (2025)
| Group | Waking hours | Alone hours | Share alone |
|---|---|---|---|
| U.S. averageAll Americans (15+) | 14.97 | 6.82 | 46% |
| Age15–19* | 13.87 | 5.16 | 37% |
| Age20–24 | 14.25 | 5.49 | 39% |
| Age25–34 | 14.92 | 6.37 | 43% |
| Age35–44 | 15.32 | 6.10 | 40% |
| Age45–54 | 15.34 | 6.88 | 45% |
| Age55–64 | 15.21 | 7.59 | 50% |
| Age65–74 | 15.04 | 8.13 | 54% |
| Age75+ | 14.92 | 8.31 | 56% |
| SexMen | 15.07 | 7.07 | 47% |
| SexWomen | 14.87 | 6.59 | 44% |
| Children at homeNo children under 18 | 14.91 | 7.65 | 51% |
| Children at homeAny children under 18 | 15.09 | 5.14 | 34% |
| Children at homeYoungest child 13–17 | 15.07 | 5.97 | 40% |
| Children at homeYoungest child 6–12 | 14.98 | 5.40 | 36% |
| Children at homeYoungest child under 6 | 15.20 | 4.27 | 28% |
| Marital statusMarried, spouse present | 15.23 | 5.82 | 38% |
| Marital statusOther marital statuses | 14.71 | 7.81 | 53% |
| Full-time earners¹Bottom earnings quarter | 15.07 | 6.14 | 41% |
| Full-time earners¹Second earnings quarter | 15.16 | 6.05 | 40% |
| Full-time earners¹Third earnings quarter | 15.34 | 6.74 | 44% |
| Full-time earners¹Top earnings quarter | 15.63 | 7.70 | 49% |
| Day of weekWeekdays (non-holiday) | 15.24 | 7.19 | 47% |
| Day of weekWeekends and holidays | 14.32 | 5.96 | 42% |
* For ages 15–19, BLS did not record who was present during 2.61 waking hours per day. Their time alone may be understated. ¹ Earnings groups cover full-time wage and salary workers with one job. Shares are calculated using each group's own waking hours. Source: BLS American Time Use Survey, Table A-8 (2025).
How we calculated this
Source: U.S. Bureau of Labor Statistics, American Time Use Survey, Table A-8, 2025 annual averages, released June 25, 2026.
We divided each group's average daily hours alone by its average waking hours and multiplied by 100. For example, 6.82 hours alone out of 14.97 waking hours equals 45.6%, rounded to 46%.
Important limitations: The survey measures physical presence, not loneliness. Information about who was present was unavailable for some activities, meaning recorded time alone may be understated. The BLS also suspended survey collection from October 1 through November 12, 2025, during the federal government shutdown, which may have affected the annual estimates.
loading