This maximum drawdown calculator is a wise tool that indicates the risk of an asset, an investment, or a portfolio by measuring how much CAGR difference there is between a maximum peak value and a subsequent lowest value. In this article, we will cover:
- The definition of maximum drawdown;
- How to calculate the maximum drawdown;
- What investors think about it; and
- Real-life examples of maximum drawdown.
What is the maximum drawdown?
The maximum drawdown is a financial indicator that shows how much the value of an investment has lost from its last peak or maximum value. It is expressed as a percentage.
Investors and financial analysts consider it when building portfolios because the maximum drawdown hints about future risk. They compute the future expected stock returns based on the historical returns. Yes, indeed! The future is projected based on past information.
In the beta stock calculator, we used the covariance and variance formula of past returns to indicate asset volatility versus the market. Furthermore, the capital asset pricing model uses a stock's beta to calculate future returns. Hence, you can see that in finance, the future is considered to be similar to the past.
From that point of view, and considering the symmetric normal distribution of returns given a stock:
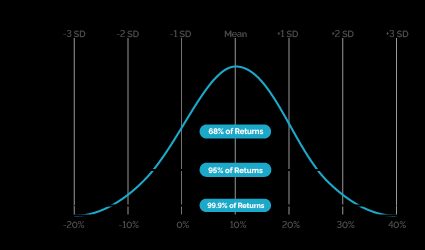
We can deduce that large drawdowns (long-tail events) happen as well as large upsides. Both situations can happen again in the future. Thus, to minimize that risk, investors optimize the portfolio with tools like sharpe ratio.
For example, consider having 50% of the portfolio in a stock that falls 50% in value. Recovering after such loss could take years which will also have an intrinsic cost, the time value of money.
How do you calculate the maximum drawdown?
We've discussed the definition of maximum drawdown, so it's high time we told you how it's actually computed. The maximum drawdown formula is quite simple:
MD = (LP - PV) / PV × 100%
where:
MD– Maximum drawdown, in percent;LP– Lowest value after peak value; andPV– Peak value.
Let's evaluate the maximum drawdown of the S&P500 index ETF, the SPY, and compare it to the most famous cryptocurrency, Bitcoin. You can verify both results in our maximum drawdown calculator.
For the SPY, we have the biggest drawdown to be around March 2020, when the OMS declared COVID-19 a pandemic disease. There we saw:
SPY peak value = 276.21
SPY lowest value after peak value = 222.83
Therefore, SPY maximum drawdown = -19.33%
On the other hand, Bitcoin experienced its maximum drawdown during December 2017 and December 2018. There we had:
BTC peak value = 19252.96
BTC lowest value after peak value = 3178.62
So, BTC maximum drawdown = -83.49%
Because the maximum drawdown of BTC is more significant (over four times), we can state that BTC involves much more risk than SPY. Consequently, asset allocation should be lower when building a portfolio for a more risk-averse investor.
How much time for recovering from a maximum drawdown?
The required recovery time depends on the compound annual growth rate at which the investment price will increase. See the compound growth calculator.
In our maximum drawdown calculator, we have included a feature to add the growth rate (CAGR) and see how many years it will take to recover after a loss. Click on the "Time for recovery" heading to open it. For example, a drawdown of 50% will require five years to break even at a CAGR of 15%.
The best way to reduce the recovery time is to reduce the maximum drawdown event probability. While it is not an easy task, the [free cash flow margin calculator] can help you find suitable investments. Besides, buying the stock at a fair price or below the fair price calculated by the discounted cash flow model can also reduce the investment risk.
FAQs
What is portfolio maximum drawdown?
It is a financial metric that indicates the most significant drop in price from an investment. It means risk because investors and analysts consider past returns likely to happen again. You can calculate it with Omni's maximum drawdown calculator or by measuring the percentage difference from the investment peak value to the subsequent lowest value.
What is a good maximum drawdown?
A good maximum drawdown is lower than the average of the market. In general, you want to lose less than the overall market because you would need less upside to recover. For example, if your investment has a drawdown of 10%, you need to gain 11% to be at breakeven. However, if you lose 50%, you need a 100% gain to get back to zero loss.
What is the worst maximum drawdown?
The maximum drawdown is -100%, which means a total loss. Such a terrible situation can happen when the company is involved in accounting fraud or other illegal practices. The main problem is that you cannot recover from a -100% maximum drawdown. You lose it all. It's game over.
How much time do drawdowns last?
Any drawdown can be recovered; however, the time it requires will depend on the maximum drawdown and the compounded annual growth rate (CAGR) for recovery. Remember that for a 10% loss, you need an 11% gain, which you can recover in 6 months, given a CAGR of 10%. For the same CAGR, a loss of 50% will need a bit more than seven years to break even.
How do I calculate maximum drawdown?
To determine the maximum drawdown, follow these steps:
- First, get the latest peak value (PV). Then, obtain the lowest price value (LP) after such a peak.
- Once you have both, divide LP by PV. Subtract 1, and multiply the result by 100%.
- The result indicates the maximum drawdown percentage.