The beta stock calculator determines the beta of a stock, which is a measure of how volatile a stockis relative to the benchmark market. In this beta stock calculator, you will learn what the beta coefficient is, how to calculate the beta value of a stock, and how to interpret it for your investment analysis.
What does beta mean in stocks?
The beta coefficient is an indicator of the correlation of a stock (or a portfolio) compared to the overall market to which it belongs.
Using a statistical approach, we analyze the historical returns of a company and the overall market. Therefore, we can identify what happened with the stock when the market went up/down and consider it an indication for the future.
The risk of the market is represented by its volatility, meaning, tomorrow or any day, it can go up 10% or go down 10%. The beta coefficient indicates what happened in the past to the stock when such price fluctuations occurred. Did the stock go up when the market was up, both went down, or maybe the opposite?
We tend to reduce such volatility in the portfolio by diversifying it with several stocks with different betas (for example, high beta stocks with low beta stocks). The more we diversify, the less stock-related risk we get, because our portfolio becomes more like the market. However, still, there is a risk – the market risk itself. Otherwise, investing in the stock market would be the safest place to put our money, and we know it's not.
We can consider the market risk as a risk you cannot mitigate away because it is the market; it represents the overall securities asset class. This risk is called systematic risk, and it's affected by macroeconomic variables like inflation, politics, interests rates, etc. The stock-specific risk is known as unsystematic risk.
The beta coefficient is the value that relates the systematic risk to the unsystematic risk by comparing the rate of change between the stock and the market. We will see the formula in the next section and then discuss how to calculate a stock's beta for real-life data.
Another main way of using the stock beta definition is to calculate the relationship between the expected return of an asset over the systematic risk. Sounds complex, eh? You can check more in our capital asset pricing model CAPM calculator.
Formula for stock beta
To calculate the beta of a stock, you need to have its historical prices. The bigger the dataset, the better. At least two years are acceptable, and five years of monthly data is the best.
- First, we have to calculate the returns of stock either by using our cool stock calculator or the following formula:
-
Then, we conduct the same operation for the benchmark. For USA companies, we can use the SP500 or the NASDAQ-100 index. Here we could use the SPY ETF or the QQQ ETF respectively. We can download the daily prices from the .
Again, we have to calculate the returns of the benchmark (market):
-
Once we have the dataset of the returns, we get the variance calculator with the returns of the market, and the covariance calculator with the returns of the market and the stock.
-
Finally, we divide the covariance by variance and get beta:
Now you know how to calculate the beta of a stock using the stock beta formula. In the next paragraph, we will analyze a real-life example.
How to calculate beta of stock — an example
For this example, we are going to consider the following company: and compare it to the . Only the monthly prices for the last five years have been included.
Note we have 61 data points that belong to the monthly data of the last five years. Then we would have:
, the first return of the historical prices of Electronic Arts stock.
, the last return that can be calculated for the stock.
Similarly,
, the first return of the historical prices of SPY ETF.
, the last return that can be calculated for the benchmark
Once we obtain all the returns in between, we continue with the covariance and variance:
Finally, we calculate the beta of our stock:
The result can be rounded to 0.90, which is the result we find over a famous stock screener: . On the other hand, please check the next figure:
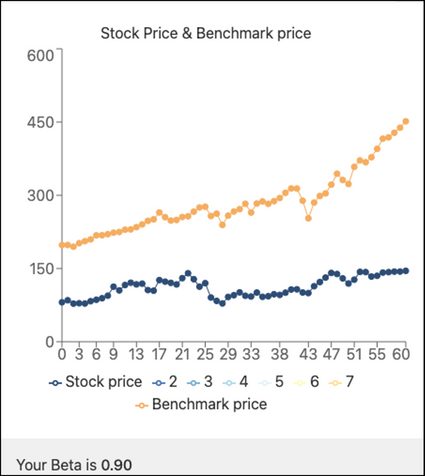
Notice that the stock (EA) has a positive correlation with the benchmark price (SPY); both have increased their value over time, but we notice the benchmark gained more upside than the stock (128% vs. 80%).
That is precisely the interpretation of β<1: The stock is less volatile than the market, meaning that whatever upside the market would have, the stock would also grow but less. In the next section, we will discuss in more detail what does beta means in stocks.
How to interpret the beta coefficient
A company with small market capitalization that presents amazing revenue growth, will very likely surpass the returns of the benchmark; thus, showing a beta higher than one. Let's say β = 2.
A beta of 2 means the stock is 100% more volatile than the market. If the market moves up 10%, the theory says, the stock will return a positive 20%.
However, the very same company, with the same beta, can be highly leveraged with a poor interest coverage ratio. Consequently, it can lose 20% when the market loses just 10%.
Beta has to be always analyzed together with other financial tools such as return on capital employed calculator or free cash flow growth. However, we have to adapt our analysis and define which investing strategy we are going to follow based on the five beta cases:
-
β > 1 — As mentioned above, a company's returns with such a beta will swing more wildly than the market. With β = 1.5, if the market loses 10%, the stock would lose 15%. Vice versa, the stock would gain 15% for a market gain of 10%. Technological and innovative companies are considered high beta stocks.
-
β = 1 — It means the stock returns mirror the returns of the market to which it is compared. If the benchmark goes up 10%, the stock will go exactly 10%. A mutual fund that emulates the SP500 would have β = 1.
-
β < 1 — The stock is less volatile than the benchmark. Some examples are well-positioned, anti-recession businesses like Coca-Cola or Johnson & Johnson. Such companies will experience less percentual drawdown compared to the market because they are more stable and solid than the average companies of the market.
-
β = 0 — The asset shows no correlation with the market. Cash, for example, is considered to have zero correlation with the returns of the market. It will keep its value (considering no inflation) regardless if the broad market goes up or down.
-
β < 0 — Negative beta stocks show an opposite correlation compared to the benchmark. It means when the market goes up, the stock goes down and vice-versa. The Vanguard Long-Term Bond Index ETF showed a negative beta compared to the SPY ETF from 2011 to 2019.
Notice in the next chart the reaction of the following stocks in the market crash of March 2020: Fortinet (β = 1.12), Johnson & Johnson (β = 0.7), and the market, SPY (β = 1).
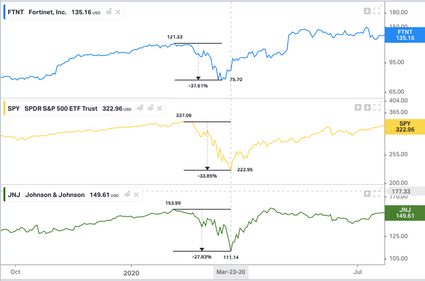
The company with the biggest beta experienced the significant drawdown: Fortinet (-37.61% from maximum price previous to the crash); meanwhile, the company with the lowest beta had the least drawdown: Johnson & Johnson (-27.83%). This evidence helps prove the stock beta definition. The market, with a beta in between, experienced a drawdown in the middle.
Other concepts for investing risk management
Here we will mention two points to be considered in the risk management related to this beta calculator.
-
If you are looking for less risk in investing, including low beta stocks or negative beta stocks/assets are the best idea; however, buying the asset at the right price is critical. We recommend you calculate the fair price of the stock you plan to acquire by using our discounted cash flow calculator.
-
The Unlevered beta calculator is another tool for measuring the risk of a company in the stock market but without considering the effects of corporate debt in the business.
FAQs
What is a good beta coefficient of a stock?
The proper beta coefficient is the one in accordance with the investor's risk tolerance. While one investor will be comfortable seeing their portfolio going down by 20%, another, more risk-averse one, would be panicking. Thus, investing goals and risk tolerance shall be considered when reviewing the beta of a stock.
What is the importance of the beta coefficient?
The beta of a stock is of utmost importance since it indicates how much the stock would go up or down relative to the benchmark price movements based on a historical-statistical approach. It allows the investors and financial planners to pick investments and prepare themselves for future price fluctuations.
How do I interpret the beta coefficient of a stock?
The meaning of stock beta value is the following:
- Beta > 1: The stock will rise or fall more aggressively than the market.
- Beta = 1: The stock will mirror the market price movements.
- 0 < Beta < 1: The stock will rise or fall less aggressively than the market.
- Beta = 0: The stock does not have any price correlation relative to the market.
- Beta < 0: The stock price will go in the opposite direction compared to the market.
How do I calculate the beta value of a stock?
To calculate the beta of a stock, we need its historical prices and the same data from the market we want to compare. We recommend a long-term approach: 5 years of monthly prices.
- Determine the returns between consecutive periods for both the stock and the market over the whole period under consideration.
- Compute the variance of the returns of the market.
- Evaluate the covariance of the returns of the market and the stock.
- Finally, calculate beta by dividing the covariance by the variance.