
Omni Calculator logo

Table of contents

1. Just over 4 in 10 have AI tools that are approved but optional

1 in 4 Workers Secretly Avoid AI at Work (2026 Survey)

Add as preferred on Google

Report Highlights

  • About 1 in 4 workers (26%) have secretly avoided or refused AI at work without telling their manager or team.
  • Pride is the top reason workers limit AI (39%), ahead of distrust in its accuracy (33%).
  • Nearly half (45%) have avoided an AI tool and done the task by hand instead.
  • Just 4% completely trust AI to handle important work tasks, while 39% trust it for small things only.
  • Gen Z is the most skeptical generation, with 48% distrusting AI's accuracy, compared with 29% of Gen X.

Most Americans can use AI on the job, but some quietly opt out. In our 2026 survey of 918 employed adults, about 1 in 4 (26%) admitted to avoiding or refusing AI without telling their manager or team.

The reason is rarely fear: workers most often skip AI out of pride in their own work, and the leaders who push it hardest are among the likeliest to dodge it in secret.

To start, we asked respondents whether their companies provide or sanction the use of AI tools.

Nearly two-thirds of workers (64%) said they have access to employer-backed AI at work, whether it's approved for optional use or officially expected. The most common setup, reported by 42%, is tools that are approved but not required. Another 22% have official tools they are expected to use.

A further 28% could use AI but lack formal approval, and just 5% are entirely blocked from it.
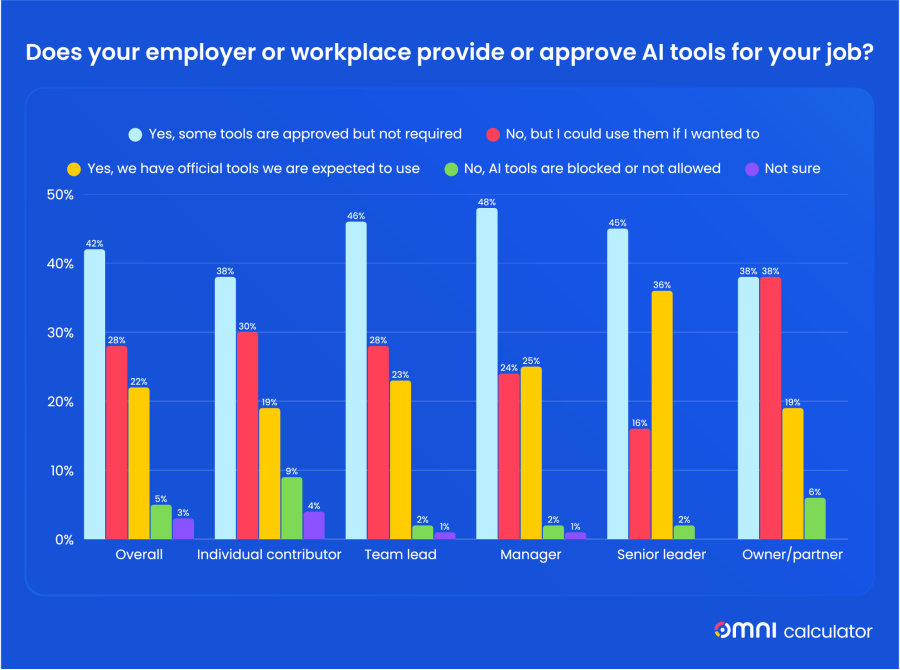
column chart showing how workplace AI access varies by job seniority
Does your employer or workplace provide or approve AI tools for your job (e.g., ChatGPT, Microsoft Copilot, Google Gemini, or Claude)?

Senior leaders are most likely to face required tools, at 36%, versus 19% of individual contributors. Owners/partners lean the other way: 38% could use AI if they wanted, compared with 16% of senior leaders.

Hard rules on AI are rare, in either direction.

A majority of workers (56%) say AI is allowed, but no one pushes it. Another 26% say leadership strongly encourages it but doesn’t make it mandatory.

Requiring AI, discouraging it, and banning it each apply to just 4% of workplaces.

What is your workplace's general stance on using AI for your job?

Overall

Gen Z

Millennials

Gen X

Baby boomers

Individual contributor

Team lead

Manager

Senior leader

Owner/partner

Allowed: it is fine, but no one pushes it

56%

53%

55%

58%

57%

53%

59%

60%

45%

63%

Strongly encouraged: leadership pushes it, but it is not a rule

26%

33%

29%

23%

22%

21%

33%

30%

42%

28%

Not sure

6%

5%

3%

6%

11%

9%

3%

2%

2%

0%

Required: I am told I must use it

4%

3%

5%

4%

4%

6%

2%

3%

7%

3%

Discouraged: leadership prefers we avoid it

4%

4%

3%

4%

3%

5%

1%

4%

2%

3%

Banned: we are told not to use it

4%

3%

4%

4%

3%

7%

2%

1%

2%

3%

Encouragement skews young, with Gen Z (33%) and millennials (29%) reporting leadership pushing AI more than baby boomers (22%).

Moreover, the divide is sharper by rank, as senior leaders report strong encouragement at 42%, double the 21% rate among individual contributors.

Daily AI use is common: 29% of workers reach for AI every day, and another 31% use it a few times a week. About 1 in 5 (19%) didn’t use AI at all in the past 30 days.

In the last 30 days, how often did you use AI tools for work tasks?

Overall

Gen Z

Millennials

Gen X

Baby boomers

Individual contributor

Team lead

Manager

Senior leader

Owner/partner

A few times a week

31%

36%

28%

33%

24%

25%

38%

37%

27%

28%

Every day

29%

29%

29%

29%

26%

24%

28%

34%

49%

38%

Not at all in the last 30 days

19%

21%

16%

18%

23%

28%

9%

9%

7%

16%

About once a week

11%

6%

14%

9%

17%

10%

14%

13%

9%

9%

One to three times in the month

10%

8%

12%

10%

9%

12%

11%

8%

5%

9%

Not sure

1%

1%

0%

0%

2%

1%

1%

0%

2%

0%

Our data also show that senior leaders are the heaviest daily users at 49%, compared with 24% of individual contributors. Individual contributors, on the other hand, are the most likely to have skipped AI entirely, at 28%, compared with 7% of senior leaders.

By generation, Gen Z favors frequent but not daily use, with 36% turning to AI a few times a week, compared with 24% of baby boomers.

Working manually is the most common form of quiet AI pushback, reported by 45% of workers.

Still, 42% report none of the listed behaviors.
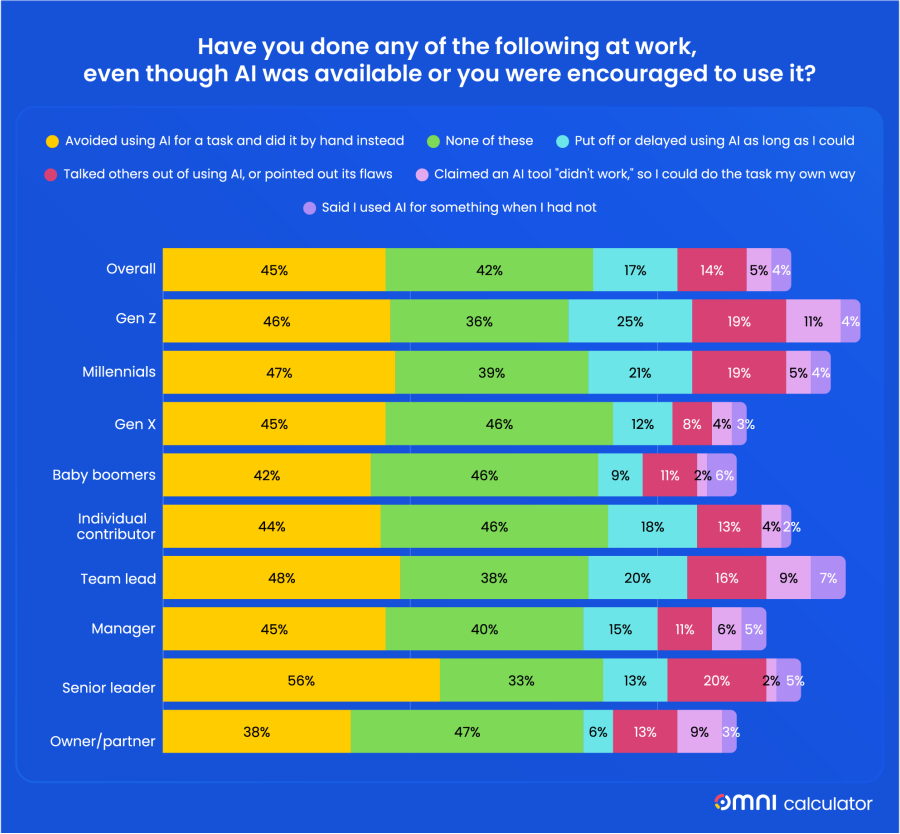
Stacked bar chart ranking the ways workers push back on AI at work
Have you done any of the following at work, even though AI was available or you were encouraged to use it?

Smaller groups have delayed AI as long as possible (17%) or talked others out of using it (14%). A few have gone further, claiming a tool "didn't work" to avoid it (5%) or saying they used AI when they hadn’t (4%).

Senior leaders push back hardest: 56% have done a task by hand rather than using AI, compared with 38% of owners/partners. Gen Z (25%) and millennials (21%), on the other hand, have delayed AI as long as they could, compared with 9% of baby boomers. Gen Z and millennials are also the most likely to have talked others out of using AI, at 19%, compared with 8% of Gen X.

We also asked workers, in their own words, about the last time they chose to skip AI and why.

  • The most common theme is the protection of a personal voice. Many want emails and messages to sound genuine rather than generic, especially for sensitive or personal notes.

  • Others skip AI when a task is too simple to be worth the effort of prompting, reviewing, and correcting the result.

  • Accuracy and trust concerns surface often, with workers citing past errors or hallucinations in specialized work.

  • Privacy is another driver, as some refuse to enter financial, medical, or confidential client data into AI tools.

A final theme is skill preservation, with workers keeping their own abilities sharp rather than outsourcing core work.

Next, we asked survey respondents whether they'd ever quietly opted out of using AI for an assignment, and about 1 in 4 (26%) said "Yes."

Most of that group resists more than once: 13% a few times, 9% regularly, and 4% once.

Have you ever avoided or refused to use AI for a work task without telling your manager or team?

Overall

Individual contributor

Team lead

Manager

Senior leader

Owner/partner

No, never

73%

80%

67%

68%

60%

84%

Yes, I have done it a few times

13%

9%

15%

17%

20%

6%

Yes, I do this regularly

9%

8%

12%

8%

13%

3%

Yes, once

4%

2%

5%

6%

7%

0%

Prefer not to say

1%

2%

1%

1%

0%

6%

Interestingly, senior leaders, the heaviest users, are also the most likely to dodge it in secret: 40% have done so at least once, compared with 9% of owners/partners.

Owners/partners (84%) and individual contributors (80%) are the most likely to say they never have.

Faking AI use is rare: about 1 in 10 workers (10%) have told someone they used AI to complete a task they did themselves.

That breaks down to 8% who have done it once or twice, and 2% who’ve done it many times.

Have you ever told someone at work that you used AI for a task when you had really done it yourself?

Overall

Individual contributor

Team lead

Manager

Senior leader

Owner/partner

No, never

89%

94%

81%

84%

87%

94%

Yes, once or twice

8%

4%

16%

11%

9%

3%

Yes, many times

2%

1%

2%

4%

4%

0%

Prefer not to say

1%

1%

2%

0%

0%

3%

By seniority, team leads (16%) have claimed AI use once or twice, compared with 4% of individual contributors. Individual contributors and owners/partners, on the other hand, are the least likely to have ever done it, both at 94% saying never.

The leading brake on AI is professional pride. Pride in doing the work themselves tops the list at 39%, ahead of the 33% who distrust AI's accuracy.

Other prominent brakes include time spent on fixing output (29%), ethical concerns (22%), privacy concerns (21%), and energy and water use (21%).
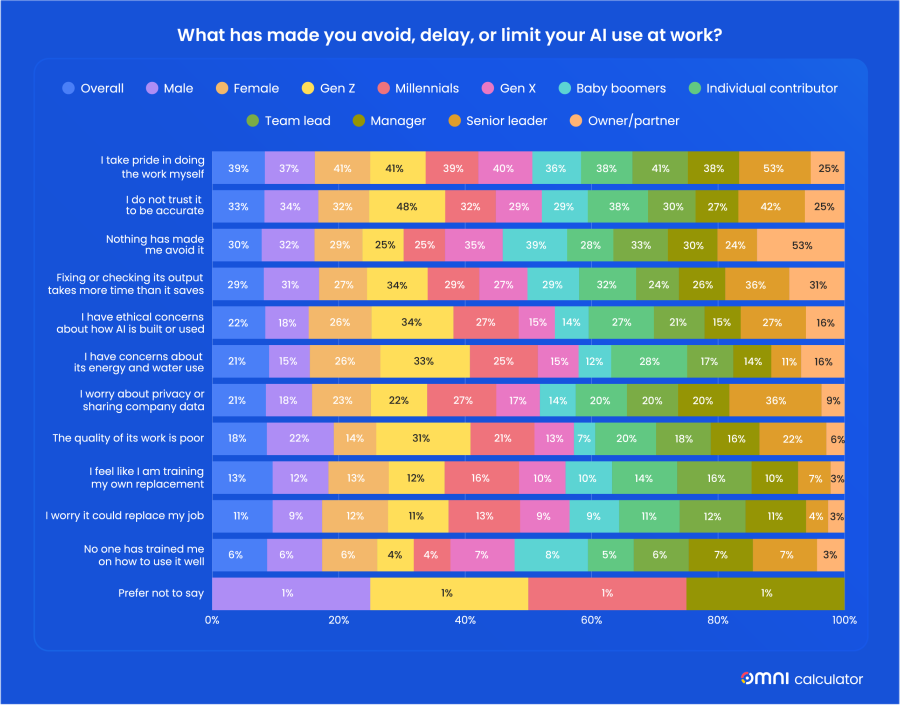
Stacked bar chart ranking why workers avoid, delay, or limit AI at work
What has made you avoid, delay, or limit your AI use at work?

Interestingly, Gen Z is the most skeptical generation across nearly every reason. They lead in distrust of accuracy (48% vs 29% of Gen X), ethical concerns (34% vs 14% of baby boomers), and energy and water use (33% vs 12% of baby boomers).

Women cite ethical concerns (26% vs 18%) and energy and water use (26% vs 15%) more than men, while men more often call AI's output quality poor (22% vs 14%).

Lastly, senior leaders lead on pride at 53%, versus 25% of owners/partners, who are the most likely to say nothing has made them avoid AI (53%).

At this stage, we asked Americans how it makes them feel when they’re expected to use AI for work. Indifference is the most common feeling, cited by 19%, with curiosity and relief following, tied at 12% each.

Negative reactions are uncommon: 6% feel anxious, 4% resentful, and 2% exhausted.

When you are expected to use AI for your work, how does it most often make you feel?

Overall

Individual contributor

Team lead

Manager

Senior leader

Owner/partner

Not applicable: I am not expected to use AI at work

38%

48%

31%

27%

25%

34%

Indifferent

19%

19%

16%

17%

29%

19%

Curious

12%

7%

14%

17%

11%

22%

Relieved

12%

7%

14%

17%

18%

6%

Energized

7%

3%

10%

11%

7%

9%

Anxious

6%

5%

8%

6%

2%

3%

Resentful

4%

6%

4%

1%

4%

3%

Exhausted

2%

2%

2%

3%

2%

3%

Not sure

2%

2%

1%

1%

2%

0%

The data also show that senior leaders are the most likely to feel indifferent, at 29%, compared with 19% of individual contributors.

When it comes to trusting AI with critical tasks, only 4% of workers trust the technology entirely. Instead, the majority are more cautious: 34% trust AI for most tasks, while 39% limit that trust to minor assignments only.

Outright distrust is a minority view, at 13% who don’t trust AI much and 8% who don’t trust it at all.

How much do you trust AI tools to handle important work tasks correctly?

Overall

Gen Z

Millennials

Gen X

Baby boomers

Individual contributor

Team lead

Manager

Senior leader

Owner/partner

I trust them for small things only

39%

46%

43%

34%

32%

43%

39%

34%

24%

31%

I trust them for most things

34%

20%

33%

39%

46%

26%

40%

42%

45%

47%

I do not trust them much

13%

15%

11%

15%

8%

15%

10%

11%

15%

6%

I do not trust them at all

8%

11%

8%

6%

9%

11%

5%

4%

7%

9%

I trust them completely

4%

8%

4%

3%

4%

3%

6%

6%

9%

3%

Not sure

2%

0%

2%

3%

1%

2%

1%

2%

0%

3%

By generation, baby boomers trust AI for most things at 46%, more than double Gen Z's 20%. Gen Z instead leans toward minimalism, with 46% trusting AI only for small things, compared with 32% of baby boomers.

Senior leaders and owners/partners trust AI for most things, at 45% and 47%, respectively, versus 26% of individual contributors.

As our last question, we asked US workers how they’d like to do their core work if handed a free choice. A combined 64% would either limit AI to small tasks or avoid it entirely, even at the cost of time.

A plurality (42%) would use AI only for small tasks and handle the important parts themselves. Another 22% would do the work themselves even if it took longer. Just 6% would use AI for everything they could, and the remaining 28% would use it to save time, even if it meant fixing mistakes.
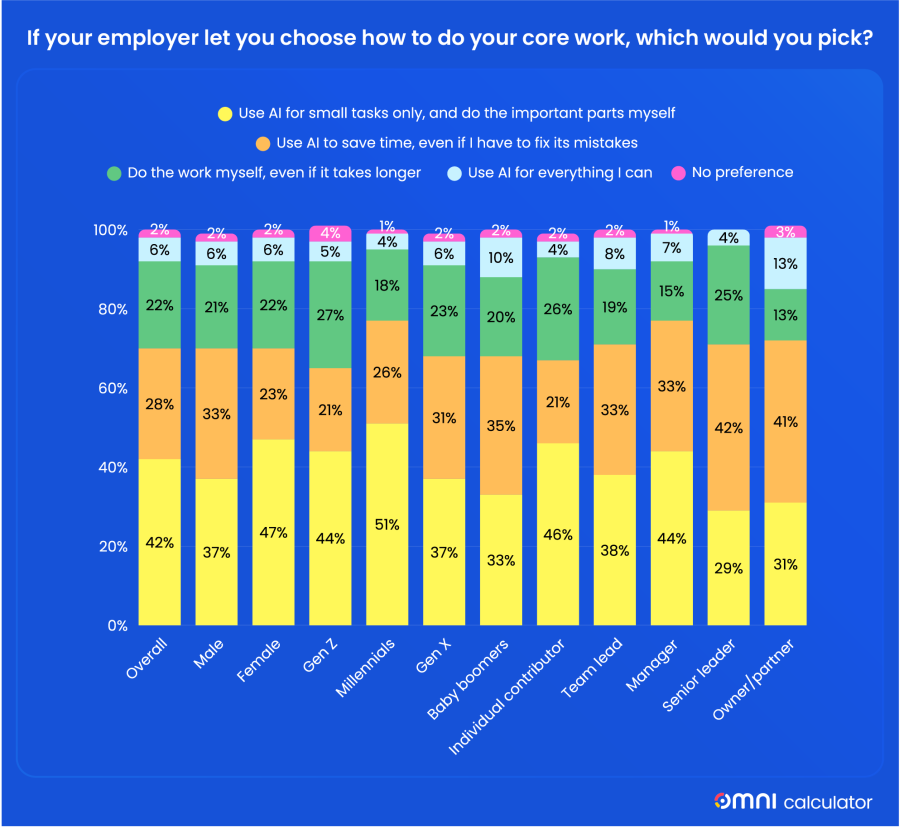
Stacked column chart showing how workers would use AI if they could choose
If your employer let you choose how to do your core work, which would you pick?

Sex-wise, women lean toward minimal use, with 47% choosing AI for small tasks only, compared with 37% of men. Men are more likely to accept AI's mistakes to save time (33% vs 23%). Millennials most favor small-tasks-only, at 51%, compared with 33% of baby boomers.

Senior leaders (42%) and owners/partners (41%) prefer saving time even with fixes, versus 21% of individual contributors.

Omni Calculator surveyed 961 US workers between June 8 and June 15, 2026, using the Prolific online research platform. After responses that failed the attention check were removed, 918 responses remained for analysis. All respondents were screened to be based in the United States and currently employed. The sample was balanced to match US Census proportions.

The sample was 51% female, 48% male, and 1% other or undisclosed. By generation: Gen X (ages 46–61) 37%, millennials (ages 30–45) 32%, Gen Z (ages 18–29) 18%, and baby boomers (ages 62+) 13%. Work setting split 45% fully in person, 32% hybrid, and 22% fully remote. The top industries were technology or software (14%), healthcare (14%), retail or hospitality (13%), and education (11%). Results are reported at a 95% confidence level with a 3% margin of error. Percentages are rounded to the nearest whole number and may not sum to exactly 100%. Questions that allowed more than one answer sum to more than 100%.

Omni Calculator helps over 15 million monthly users solve calculation problems through 3,800+ expert-reviewed tools.

The content in this article is for noncommercial use only. When sharing, please include a link back to Omni Calculator as the original source.

Need to run some quick numbers? Check out the calculators below for help with your pay, commute, and career moves.

Authors of the report

Ask the authors for a quote

Copyrights