Omni Calculator logo

Confidence Interval and Effect Size Applied to Clinical Meaningfulness in Sport

When you think about sports, the word “performance” comes to mind. But how can we properly evaluate the statistical significance of a dataset related to a treatment to increase athletes’ performance?

This question is the main subject of the work titled “Statistical Primer for Athletic Trainers: Using Confidence Intervals and Effect Sizes to Evaluate Clinical Meaningfulness”, introduced in 2016 by Monica Lininger and Bryan L Riemann, and published in the Journal of Athletic Training — the link for this publication is available in the references of this report.

Along with this report, we will guide you on a journey through interesting applications of confidence intervals and effect sizes.

💡 Beyond this article, you will see that we have a lot of content and tools for you. Expand your learning skills by registering for an Omni Account today. It is fast, easy, and it allows you to create, edit, and share calculators. You can also access the previous tools used in the blink of an eye.

Female athletes running

To evaluate the statistical significance of a dataset, we need to use parameters. Among them, we highlight the p-value, the confidence interval, and the effect size.

Before talking about the p-value, we need to approach the concept of null hypothesis (H0\mathrm{H}_0). The null hypothesis is the default claim in a statistical test, in which we assume that there is no effect, difference, or association in the population. In simple terms, this means that any differences in the statistical quantities are due to random chance (sampling variation), rather than a real underlying effect.

The p-value is calculated under the assumption that the null hypothesis is true. It is a number between 00 and 11 that indicates the probability of obtaining results at least as extreme as the one actually observed purely by random chance. So, a small p-value means that such an extreme result would be very unlikely.

🙋 If you are curious about how to determine the p-value, access our p-value calculator. Feel free also to check out our z-score calculator.

Despite its broad applicability, knowing the p-value may not give you enough information about the statistical significance of an observation, and can mislead your decision. This issue is particularly critical in some areas such as medicine, business, and sports.

To be more confident about the statistical significance, we can compute a confidence interval for the population. As you may know, every estimate will be based on samples, since it is impossible to evaluate the entire population. So the result will lie within an interval because it has inherent sampling error.

This range is precisely the confidence interval, and it measures the level of trust that you can have in your samples to compute a statistical quantity. For example, a 90% confidence interval means that after repeated random sampling, the true population means would be within the interval 90% of the time.

To derive the confidence interval for two samples, you can use the following equation:

CI=xˉ±t×s12n1+s22n2\mathrm{CI} = \bar{x} \pm t \times \sqrt{\frac{s_1^2}{n_1}+\frac{s_2^2}{n _2}}

where xˉ=xˉexpxˉcontrol\bar{x} = \bar{x}_{\mathrm{exp}} - \bar{x}_{\mathrm{control}} is the sample mean, s1s_1 is the standard deviation of the control sample, s2s_2 is the standard deviation of the experimental sample, n1n_1 and n2n_2 are the sample sizes, and tt is the so called t-statistic parameter.

You can master your knowledge about confidence intervals and t-statistic by accessing our article “Sampling and Confidence Intervals for Biology and Medicine”, our confidence interval calculator, and our t-statistic calculator.

Another relevant statistical quantity is the effect size, which measures the magnitude of a phenomenon. In practical terms, the effect size can describe how large an effect is. One popular formula to compute the effect size is given by:

d=xˉcontrolxˉexpscontrold = \frac{\bar{x}_{\mathrm{control}} - \bar{x}_{\mathrm{exp}}}{s_\mathrm{control}}

where:

  • xˉcontrol\bar{x}_{\mathrm{control}} — Control sample mean;
  • xˉexp\bar{x}_{\mathrm{exp}} — Experimental sample mean; and
  • scontrols_\mathrm{control} — Standard deviation of the control sample.

The formula above is known as Cohen’s d. The interpretation of the effect size depends on its value and can be visualized in the table below:

Effect Size

Cohen

Rhea

0.20

Small

0.35

Upper limit of trivial

0.50

Medium

0.80

Large

Upper limit of small

1.50

Upper limit of moderate

Let us present to you in detail the definition of significance. The statistical significance of a given quantity can be assessed by considering whether an extreme result is unlikely under the null hypothesis. One way to evaluate the statistical significance of a sample is through the p-value. Usually, if the p-value is <0.05< 0.05, we consider the result significant.

However, there is a grey zone of interpretation when p-values are close to a given threshold. This situation motivates considering other statistical quantities in your analysis, such as confidence intervals and effect sizes. Such a procedure can be crucial in practical applications, such as assessing the clinical meaningfulness of a treatment. In an article by Monica Lininger and Bryan L. Riemann, the authors addressed this problem by comparing two treatments for improving ankle dorsiflexion in 40 patients. We will present more details about their research in the next sections.

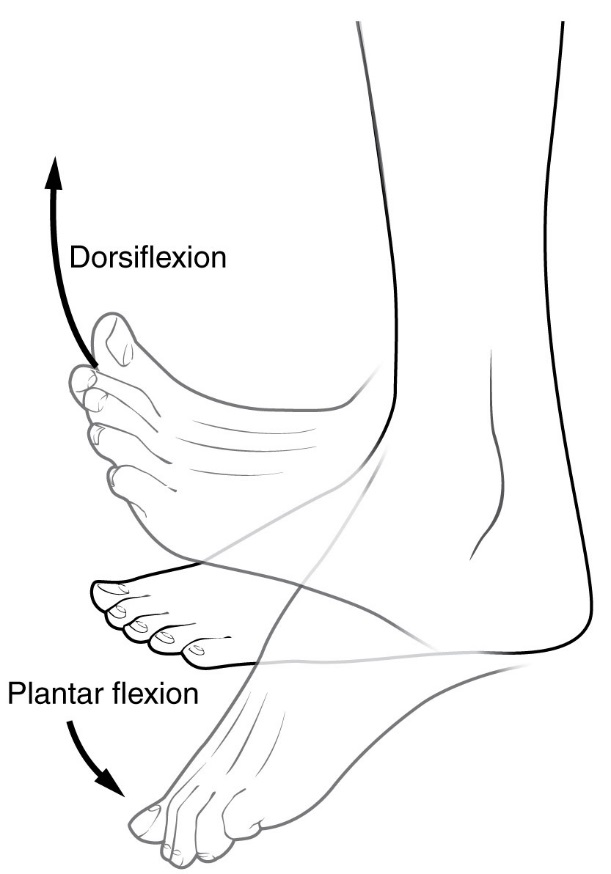
It is interesting how little we care about our daily movements. However, they can have a significant impact on our health, our lives, and our athletic performance. One example is the ankle dorsiflexion range of motion (ROM).

It is the biomechanical movement of pulling the toes/foot upward toward the shin. It is an important movement for activities such as walking, descending stairs, and sports. Studies have shown that restrictions in ankle dorsiflexion ROM may be a risk factor for various lower-limb injuries, including lateral ankle sprain and chronic ankle instability, plantar heel pain, metatarsal stress fractures, patellar tendinopathy, and Achilles tendinopathy.

Foot showing the movement of an ankle dorsiflexion

Moreover, such restrictions may impact athletic performance. Scientific investigations have shown that athletes with greater dorsiflexion angles exhibit superior deceleration during high-intensity cutting manoeuvres, enabling them to dynamically lower their center of mass during braking. Therefore, it is relevant to determine whether a given treatment is effective in patients with restricted dorsiflexion.

As we mentioned earlier, in the work “Statistical Primer for Athletic Trainers: Using Confidence Intervals and Effect Sizes to Evaluate Clinical Meaningfulness”, the authors randomly assigned 40 active people with restricted dorsiflexion into two groups. The first was a control group (standard stretching), and the second was an experimental group (myofascial release plus standard stretching). The ankle dorsiflexion range of motion (ROM) of each patient was measured before and after treatment to compare results.

The ROM improvements measured after the intervention programs were 5.7°±1.7°5.7\degree \,\pm\, 1.7\degree and 6.8°±1.5°6.8\degree \, \pm \, 1.5\degree for the control and experimental groups, respectively. From these results, they determined p=0.047p = 0.047, suggesting that incorporating myofascial release with stretching would yield a statistically significant improvement in ROM. However, to certify the clinical meaningfulness of this treatment, it was necessary to properly compute the confidence interval and the effect size.

To calculate the confidence interval, we need to determine the difference between the ROM improvements of the two groups, which means that the sample mean is:

xˉ=xˉexpxˉcontrol=6.8°5.7°=1.1°\begin{split} \bar{x} &= \bar{x}_{\mathrm{exp}} - \bar{x}_{\mathrm{control}} \\[1em] & = 6.8\degree - 5.7\degree\\[1em] & = 1.1\degree \end{split}

By using the data informed in the article, we have t=2.05t=2.05 for 95%95\% confidence interval, s1=1.7°s_1 = 1.7\degree, s2=1.5°s_2 = 1.5\degree, and n1=n2=20n_1=n_2=20, which results in:

CI=1.1°±2.05×0.51°=1.1°±1.05°=0.05°2.15°\begin{split} \mathrm{CI} &= 1.1\degree \pm 2.05 \times 0.51\degree \\[1em] & = 1.1\degree \pm 1.05\degree \\[1em] & = 0.05\degree \,– \,2.15\degree \end{split}

The confidence interval is used to estimate the magnitude of the treatment effect. The literature reports that an interval between 1°1\degree and 2°2\degree is likely trivial, resulting in clinical meaningfulness. Moreover, the effect size for this dataset is such that:

d=5.7°6.8°1.7°=0.65\begin{split} d & = \frac{5.7\degree - 6.8\degree}{1.7\degree} \\[1em] & = -0.65 \end{split}

The last result indicates that, on average, the ROM change for patients in the control group was 0.650.65 standard deviations lower than that for patients in the experimental group.

The results of this research can be summarized as follows:

  • p=0.047p = 0.047, which is below the threshold of 0.050.05, indicating that the results of the treatment are statistically significant.

  • CI=0.05°2.15°\mathrm{CI} = 0.05\degree \,– \,2.15\degree, and the minimal detectable change for dorsiflexion measurements reported in the literature varies between 5.7°5.7\degree and 7.4°7.4\degree. Thus, this intervention procedure does not result in clinical meaningfulness.

  • d=0.65d = -0.65, the interpretation of this result may depend on the categories presented in the effect size table. For Cohen’s convention, it means an intervention with a medium effect. However, the Rhea categories describe it as a small effect. Thus, the Rhea convention is consistent with the clinical meaningfulness interpretation derived from the confidence interval analysis.

Thus, you can see how statistical quantities can play an interesting role not only in guaranteeing statistical significance but also in uncovering the clinical meaninglessness of a specific treatment.


This article was written by João Rafael Lucio dos Santos and reviewed by Steven Wooding.