
Table of contents
6 in 10 Shoppers Think Most Black Friday Deals Aren't Real Savings (2026 Survey)
Report Highlights
- 58% of shoppers think no more than 4 in 10 advertised Black Friday deals offer a genuine saving, and 85% believe retailers use at least one pricing trick.
- 59% plan to use an AI chatbot for Black Friday, but only 7% start their search there. Additionally, only 4% would let AI buy for them.
- Twice as many will do most of their shopping on a computer or laptop (55%) as on a phone (26%).
- 35% of Gen Z will cut back on eating out to afford Black Friday, compared with 14% of boomers.
- 53% of buy now, pay later users expect to be paying after January, compared with 16% of other shoppers.
- 1 in 3 have bought something they didn't need because it was cheap, and 1 in 4 have waited in line for two hours or more.
Black Friday still draws most shoppers, but few trust its deals. In our 2026 survey of 899 US adults, 58% said no more than 4 in 10 advertised Black Friday deals offer a genuine saving, and 59% believe retailers raise prices in the weeks before the sale.
Shoppers are fighting back with sites that show price history, retailer comparisons, and, for a majority, AI chatbots. They're also stretching their budgets. More than half will cut back elsewhere to afford the sales, and 1 in 5 expect to be paying for this year's purchases after January.
Not sure if a deal is worth it?
Our shows what you'll really pay and save on any offer, from percent-off discounts to "buy 2, get 1 free," along with shipping and tax.
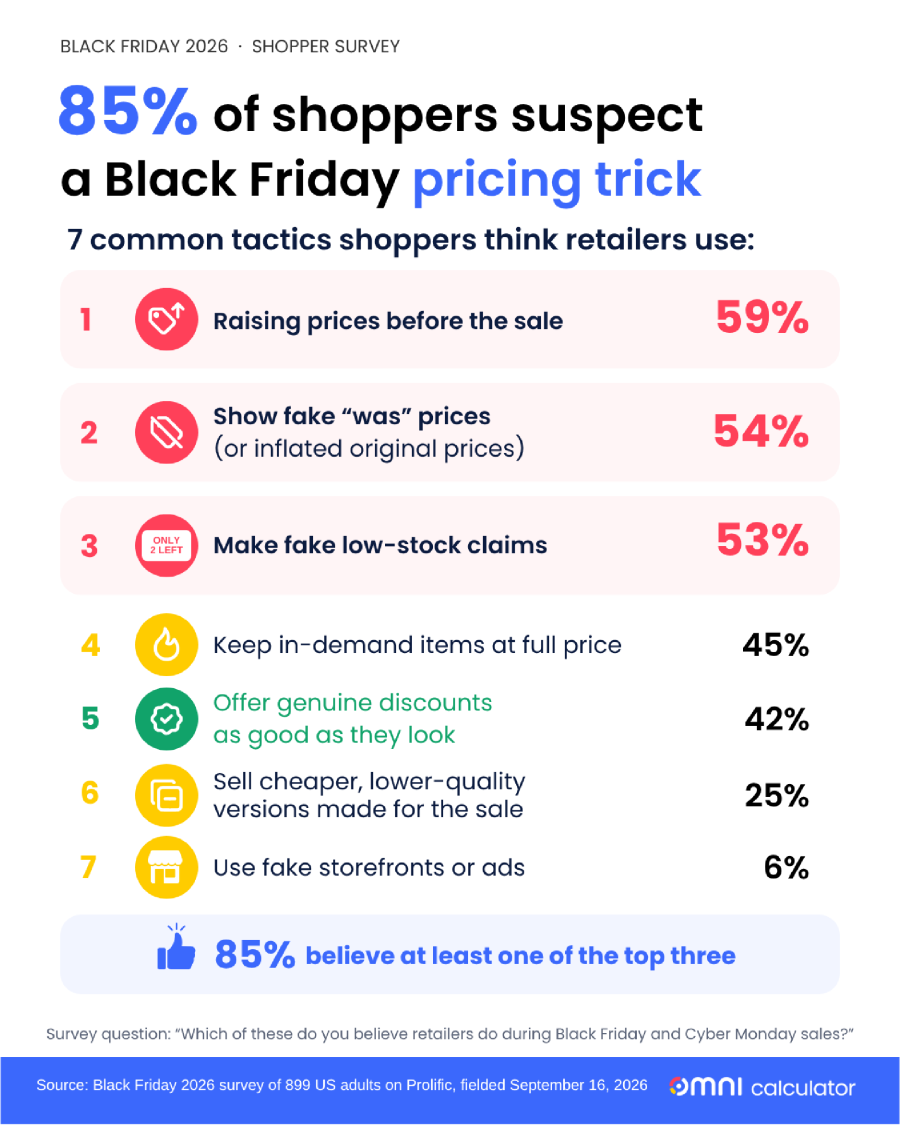
Most shoppers suspect retailers of playing games with Black Friday prices. 59% believe retailers raise prices in the weeks before the sale, then cut them back to normal, while 54% believe stores advertise a "was" price that the item never really sold at. Altogether, 85% believe at least one of the three most common tactics.
Younger shoppers are the most suspicious of "was" prices (64% of Gen Z vs 47% of boomers). Suspicion hasn't turned shoppers away from the sales, though: 42% believe some discounts really are as good as they look.
That suspicion extends to the deals themselves. When we asked how many of every 10 advertised deals offer a genuine saving, the most common answer was three or four (30%). In total, 58% think no more than 4 in 10 are real savings, while only fewer than 1 in 10 believe 8 or more are. Women are the more skeptical group. 61% put the figure at four or less, compared with 54% of men.
Question: Out of every 10 Black Friday deals you see advertised, how many do you think offer a genuine saving compared with what the item normally costs?
Answer | Overall | Gen Z | Millennials | Gen X | Boomers | Women | Men |
|---|---|---|---|---|---|---|---|
Three or four out of 10 | 30% | 34% | 32% | 27% | 29% | 28% | 33% |
One or two out of 10 | 24% | 21% | 27% | 23% | 25% | 29% | 19% |
Five out of 10 | 18% | 22% | 16% | 18% | 16% | 16% | 19% |
Six or seven out of 10 | 12% | 15% | 13% | 11% | 12% | 12% | 13% |
Eight or nine out of 10 | 6% | 3% | 5% | 9% | 5% | 5% | 7% |
None of them | 3% | 2% | 2% | 3% | 3% | 4% | 2% |
All 10 of them | 3% | 1% | 1% | 3% | 5% | 3% | 3% |
To tell real deals from fake ones, shoppers use a mix of methods:
- Compare the same item across several retailers: 59%
- Look up the item's price history: 52% (59% of Gen Z and millennials vs 39% of boomers)
- Note the price themselves beforehand: 41%
- Read reviews or forums to see what others paid: 30%
- Ask an AI chatbot: 23% (28% of men vs 18% of women)
- Use a price-tracking browser extension: 15% (22% of Gen Z vs 10% of boomers)
- Take the advertised discount at face value: 7%
There's still a gap: among those who believe prices are raised before the sale, 23% use no tool to show them the earlier price, such as price history, a note of their own, or a browser extension.
59% plan to use an AI chatbot like ChatGPT, Gemini, Claude, or Copilot for at least one Black Friday task. Most want help with the research: comparing prices across stores (42%), checking whether a discount is a real saving (31%), and coming up with gift ideas (27%).
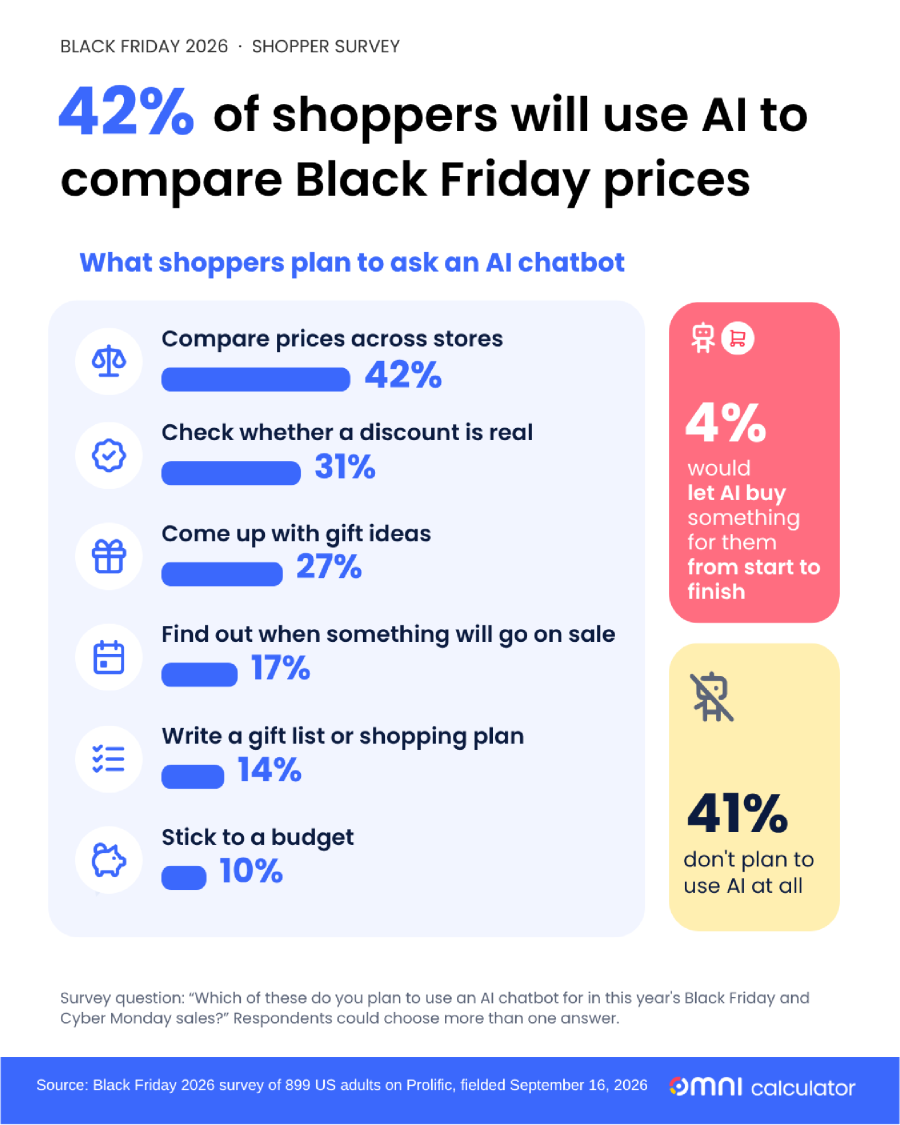
Only 4% would let AI buy something for them from start to finish.
Handing over the purchase is another matter. Only 4% would let AI buy something for them from start to finish, and just 7% start their Black Friday search on a chatbot. Amazon (31%) and Google or Bing (29%) remain the first stop, even for AI users. Among the 531 respondents who plan to use AI, only 12% start there.
Question: When you start looking for something to buy in this year's Black Friday sales, where do you go first?
Answer | Overall | Gen Z | Millennials | Gen X | Boomers | Women | Men |
|---|---|---|---|---|---|---|---|
Amazon | 31% | 22% | 29% | 34% | 36% | 33% | 29% |
A search engine | 29% | 35% | 33% | 25% | 24% | 29% | 29% |
A store's website or app | 16% | 16% | 18% | 19% | 11% | 19% | 14% |
An AI chatbot | 7% | 10% | 7% | 7% | 5% | 5% | 11% |
A physical store | 4% | 5% | 2% | 4% | 5% | 4% | 3% |
A social media app | 2% | 6% | 2% | 1% | 0% | 3% | 2% |
A friend or family member | 2% | 1% | 2% | 1% | 2% | 2% | 1% |
For most shoppers, Black Friday stretches across several weeks. Half (51%) will shop October or early November sales, and more plan to shop Cyber Monday (75%) than Black Friday itself (71%). Gen Z is the exception: 85% plan to shop on Black Friday, compared with 57% of boomers.
Smaller groups will shop Small Business Saturday (22%) and Thanksgiving Day (20%). Women are more likely than men to shop October sales (56% vs 46%) and Small Business Saturday (27% vs 16%).
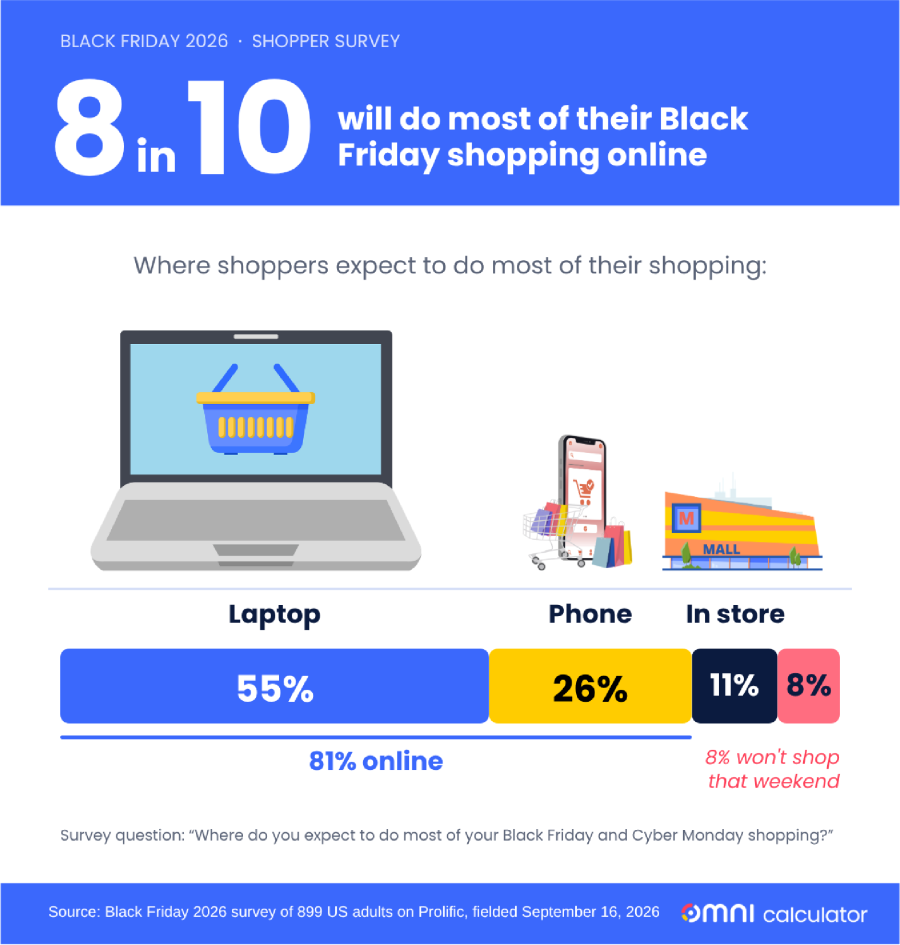
Most of that shopping will happen online, and on a bigger screen than you might expect. 55% will do most of their shopping on a computer or laptop, twice as many as on a phone or tablet (26%). Only 11% will shop mostly in stores.
Amazon leads the list of where people plan to shop (80%), well ahead of Walmart (56%), Target (38%), and Best Buy (30%). Only 9% plan to shop Temu, Shein, or similar low-cost marketplaces. Target skews young, drawing about half of Gen Z (46%) and millennials (50%) but only 24% of boomers.
Question: Which of these retailers do you plan to shop in this year's Black Friday and Cyber Monday sales? Select all that apply.
Answer | Overall | Gen Z | Millennials | Gen X | Boomers | Women | Men |
|---|---|---|---|---|---|---|---|
Amazon | 80% | 83% | 84% | 80% | 73% | 82% | 79% |
Walmart | 56% | 60% | 52% | 59% | 51% | 56% | 55% |
Target | 38% | 46% | 50% | 32% | 24% | 42% | 35% |
Best Buy | 30% | 40% | 31% | 28% | 25% | 24% | 37% |
Costco, Sam's Club, other warehouse club | 25% | 24% | 30% | 25% | 21% | 23% | 28% |
Kohl's, Macy's, other department store | 21% | 22% | 18% | 24% | 21% | 29% | 13% |
Local small business | 18% | 19% | 20% | 16% | 20% | 21% | 16% |
Home Depot, Lowe's, other home improvement store | 17% | 18% | 18% | 16% | 16% | 15% | 20% |
Temu, Shein, other low-cost marketplace | 9% | 11% | 9% | 11% | 5% | 11% | 8% |
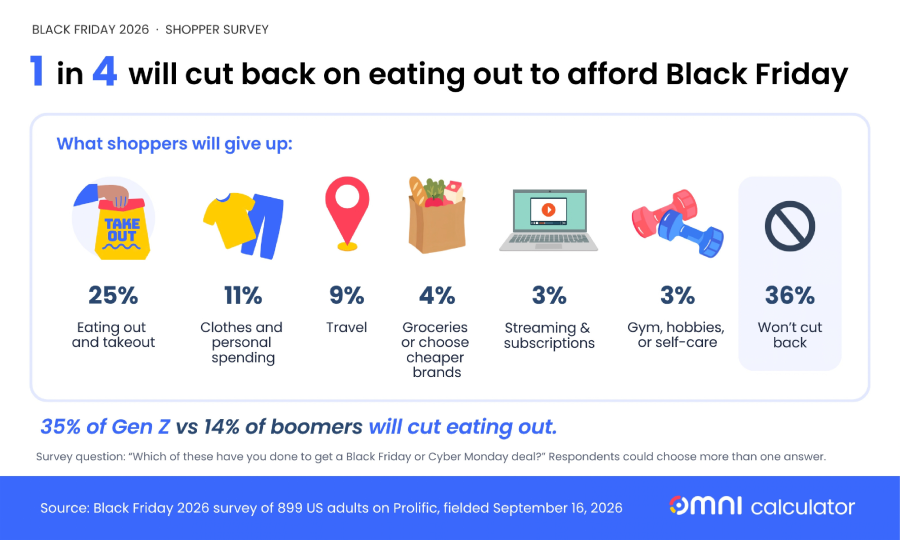
To make room for Black Friday, 55% will cut back on something else. Eating out and takeout is the first to go (25%), followed by clothes and personal spending (11%) and travel (9%). Gen Z is the most willing to give up restaurants. 35% will cut back on eating out, compared with 14% of boomers.
Most will pay with money they already have: 53% plan to use a debit card or cash, and 41% will use a credit card they'll pay off right away. 18% will carry a credit card balance, while 15% will use buy now, pay later services like Klarna, Afterpay, or Affirm.
Question: How do you plan to pay for what you buy over the Black Friday and Cyber Monday weekend? Select all that apply.
Answer | Overall | Gen Z | Millennials | Gen X | Boomers | Women | Men |
|---|---|---|---|---|---|---|---|
Debit card or cash | 53% | 64% | 57% | 49% | 46% | 58% | 48% |
Credit card, paid off in full | 41% | 46% | 45% | 36% | 39% | 37% | 47% |
Savings | 20% | 26% | 22% | 16% | 15% | 21% | 17% |
Credit card, carrying a balance | 18% | 14% | 20% | 21% | 15% | 18% | 19% |
Buy now, pay later | 15% | 19% | 19% | 14% | 8% | 19% | 12% |
Gift cards or store credit | 12% | 14% | 14% | 9% | 12% | 11% | 12% |
Not shopping | 8% | 4% | 5% | 9% | 15% | 6% | 10% |
1 in 5 expect to be paying for Black Friday after January
For some, the bill will outlast the holidays. 22% expect to be paying off this year's purchases after January, rising to 53% among buy now, pay later users, compared with 16% of other shoppers. And 6% are still paying off last year's Black Friday.
Here's when shoppers expect to finish paying off this year's purchases:
- Before the end of January: 65%
- One to three more months after January: 15%
- Four to six more months: 5%
- More than six more months: 2%
53% of buy now, pay later users expect to still be paying after January, more than three times the rate of other shoppers (16%).
Black Friday brings out some unusual behavior. 34% have bought something they didn't need because it was cheap, and 24% have waited in line for two hours or more. Smaller groups have lied about what they spent (6%), camped outside a store overnight (5%), or called in sick to shop (5%).
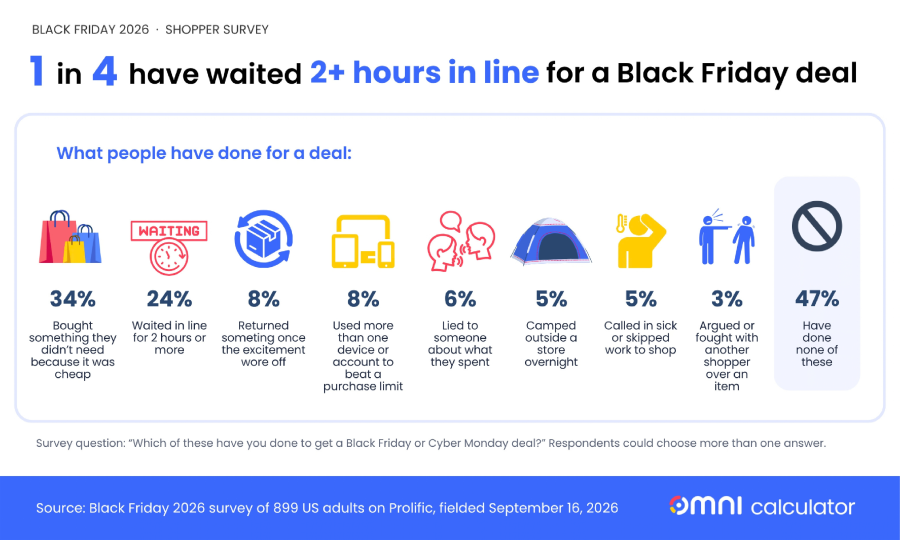
Gen Z is the most prone to impulse buys (46%, vs 20% of boomers), while men are more likely than women to have camped out overnight (8% vs 3%).
Some of those purchases don't age well. 20% could name a Black Friday buy they regret, and electronics make up about 6 in 10 of those regrets. TVs alone come up in about 1 in 5.