The noise figure is a measure of any device's contribution to the overall noise of the system in which the device is present, and our noise figure calculator calculates that value. By using this information, you can identify how much noise is being produced in that system.
In the below article, we explain the noise factor and noise figure definitions, which are similar terms with a slight difference in the way they are calculated. We use the latter, for example, in the noise figure of cascaded amplifier formula to estimate the degradation of signal-to-noise ratio (SNR) in such a system.
Continue reading to not only learn more about the formula of noise figure, but also the practical applications of noise figures in various fields of life.
What is noise figure and noise factor?
The noise figure is the common logarithm of the ratio of input SNR to output SNR, where SNR refers to the signal-to-noise ratio. This ratio is a measure of the strength of the desired signal in comparison to the acceptable level of background noise. The noise factor is a similar idea but does not use logarithms.
We can categorize any unwanted disturbance that impacts the quality of the signal as noise, and it can disrupt the data transfer of texts, graphics, audio, and video. So, studying the noise factor of a circuit or system is significant if you wish to improve the system's performance. In case you get curious about data transfer from one device to another, try our data transfer calculator.
Noise factor and noise figure definitions
The noise factor and figure measure the degradation of the signal-to-noise ratio.
When we calculate the value using a linear equation, it is noise factor, but it is a noise figure when we use a common logarithm.
Cascaded noise figure
When we connect multiple devices in a consecutive or cascaded manner, the total noise figure of such a system is called a cascaded noise figure.
The formula for the noise figure of a cascaded amplifier is:
where:
- – Noise figure of the cascade;
- – Total gain of the cascade;
- – Noise figure of the component;
- – Gain of the component; and
- – Number of components.
Noise figure calculator
The noise figure calculator allows you to determine the value of the noise figure in multiple ways, depending on the scenario in front of you. There are 4 types of calculations provided in the calculator, each with its own formula that we need to apply to determine how to calculate the noise figure based on your inputs.
The methods of calculations are:
- The signal-to-noise ratios;
- The signal-to-noise ratios in decibels (dB);
- Convert from noise factor to noise figure; and
- Cascaded noise figure.
Once you have selected how you want to determine the noise figure value, you may input the required variables.
For Methods 1 and 2, you should enter:
- The signal-to-noise ratio at the input (); and
- The signal-to-noise ratio at the output ().
The result will be noise figure in dB.
Method 3 is useful when you do not have the SNR and still need to determine the noise figure of a device. You may use the conversion of noise factor to noise figure. For this, you need to input the value of the noise factor, and the result will be the noise figure in decibels.
Method 4 is for when you have multiple devices connected and have each device's noise and gain value. You have the choice to enter values for up to 10 devices.
The result will be in terms of total noise and total gain.
For instance, let's consider Method 1. If your is 8 and is 7, then the noise figure is:
How to calculate the noise figure: the noise figure formula
The noise figure gives a value that specifies the noise performance of any device.
The noise figure values are essential for wireless networking and RF circuits. RF circuits are electronic circuits that transfer or receive radio signals and operate at a particular radio frequency. Our noise figure calculator calculates the noise figure and noise factor values of a system based on the signal-to-noise ratio of that system.
The noise figure formula in dB(decibels) is:
where:
-
– Noise figure in decibels (dB);
-
– Signal-to-noise ratio at the input; and
-
– Signal-to-noise ratio at the output.
So, let's suppose you have equal to 5 and equal to 2.
-
Divide by
-
Then, you determine the at base 10 of the ratio obtained in the first step.
-
Next, multiply it by 10.
-
The result is a noise figure value of 3.9794 dB.
We have heard of the effects of noise in terms of causing pollution. So, we decided to make a tool to create more awareness! Check out our noise pollution calculator.
Applications of noise figure
You can find some of the applications of noise figures below. They are primarily used to study the noise and performance of a device:
-
The noise figure gives an estimated difference in the noise output of a receiver in comparison to the noise output of a model receiver, keeping the overall gain, bandwidth, and temperature constant.
-
We usually use the noise figure in the circuit design of radio receivers to understand the noise performance.
-
The noise figure of a device tells us about the noise contribution of that device.
Would you be interested in our frequency calculator? It helps you find a wave's frequency given the wavelength and its velocity or period in no time.
FAQs
How can I calculate the noise figure?
You can follow the given steps to calculate the noise figure of a device:
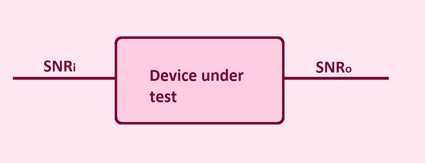
- Calculate the signal-to-noise ratio at the input terminal (SNRi) of the device.
- Calculate the signal-to-noise ratio at the output terminal (SNRo) of the device.
- Divide the SNRi by the SNRo.
- Calculate the base 10 logarithm of the ratio obtained in Step 3.
- Finally, multiply it by 10.
The resultant value is the noise figure. The noise figure formula, NF, in dB is the following:
NF = 10 × log₁₀(SNRi/SNRo)
What is a good noise figure?
Ideally, the noise figure should be 0 dB, but that is not achievable. Even the highest performance systems have some noise figure. Still, the smaller the noise figure of a system, the better it is.
The noise figure measures the signal-to-noise degradation of the system under consideration.
What is the noise figure if the SNRs are 40 and 35 dB?
The noise figure is 5 dB if the signal-to-noise ratio at input is 40 dB and signal-to-noise ratio at output is 35 dB.
We achieve the above result only if the SNR values are expressed in decibels. Instead, if the values were expressed in unitless ratios, then the resultant noise figure would be 0.5799.
Can noise figure be negative?
No, the noise figure value cannot be negative.
The signal-to-noise ratio at the input is always greater than the signal-to-noise ratio at the output, which means that the noise factor should always be greater than one.
When you take the logarithm of the noise factor, it determines the noise figure, and the log of a value greater than one is a positive number.