Welcome to our EVM calculator. Whether your project is building a skyscraper, hosting a wedding, or holding an office pizza party, applying earned value management (EVM) methodology will ensure you're on time and on budget. With the help of our EVM calculator, you'll get these insights and much more.
This accompanying article will cover what earned value management is and how to apply it in project management. We'll also discuss how to calculate earned value, planned value, and many other project progress indicators.
What is earned value management / earned value analysis?
Earned value management (sometimes called earned value analysis) is a project management methodology. It allows a project manager to inspect a project's current status, measure its performance, and predict its final cost and completion date (as opposed to its planned deadline). It has proven to be one of the most powerful project management tools out there:
-
It's flexible and scalable — You can apply earned value management to any project of any size.
-
It's robust and dynamic — It can extract hidden, but valuable insights where projects are large and tasks are hard to interpret.
-
It's reliable — that, with EVM, you can predict your final expenditures within a 10% margin when you're just 20% of the way done with your project.
To apply earned value management, the project manager must have a project plan. This plan breaks a project down into tasks and indicates each task's budget and schedule. The project manager must also know the current status of each task: how far it has progressed and how much the task has cost thus far. Without a project plan or up-to-date task information, EVM cannot deliver meaningful information.
How to use the EVM calculator
The bigger your project, the harder it's going to be to perform all the EVM calculations by hand. That's why we made the EVM calculator, which will automatically perform EVM for you with the task data you give it. The tasks appear dynamically as you enter them. At the bottom, the EVM calculator will give you a detailed EVM report. If you're not sure what the calculator's results mean, read on!
What are the earned value management formulas?
The earned value management process can be split into three steps: collecting task information, evaluating performance, and making predictions based on current knowledge. There are quite a few formulas involved; we'll explain them and what they represent as we go along.
Step 1: Collecting task information
At the start of the EVM process, we must look at all the tasks in our project and collect four data points for each task:
-
Scheduled progress, or how much of this task was supposed to have been completed by now (given in percentage);
-
Actual progress, or how much we've actually completed it (given in %);
-
Budget, or how much money our project plan says we'll spend on it; and
-
Cost, or how much money we've actually spent on it.
We must now calculate three important values for each task: planned value, actual cost, and earned value. Let's look at what these are:
- Planned value (or "budgeted cost of work scheduled") represents how much value we had planned to achieve thus far. We can calculate the planned value of a task with:
- Actual cost (or "actual cost of work performed") represents how much money we've spent thus far. If we have up-to-date expenditure information, we can simply state that:
- Earned value (or "budgeted cost of work performed") represents how much money's worth of progress we've achieved thus far. We can calculate a task's earned value with:
Step 2: Evaluating performance
Once we have each task's , , and , we can sum them to calculate the total , , and for our project as a whole. Then we can go about extracting useful information about our project's performance.
First, we'll calculate our cost performance index with:
The CPI tells us how our project's budget is doing:
- If , our project is under budget.
- If , our project is over budget.
- If , our project is exactly on budget.
Then, we'll calculate the schedule performance index, , with
Similarly to the , the tells us how our project's schedule is doing:
- If , our project is ahead of schedule.
- If , our project is behind schedule.
- If , our project is exactly on schedule.
These performance indices are ratios. So, if , it means our time performance is double what was planned, i.e., we've completed our tasks twice as fast as we had planned.
Some project managers prefer to use the slightly different but equivalent cost and schedule variances. You can calculate these with and . Here, positive answers are good news: if your cost variance is 20%, it means you're 20% under budget.
Step 3: Making predictions
We can take earned value management even further to make predictions about our project's future:
- The remaining cost of completing the project is formally called "estimate to complete" or . We can estimate it with:
By using in the equation for , we assume that our current expenditure trend will be similar in the future.
- The total cost of completing the project is called "estimate at completion" or , and we can estimate it with:
We can think of as the sum of the costs so far and the costs that are projected to remain.
An example of earned value management
Let's apply earned value management to an example. You can use our EVM calculator to work along and build your understanding. Suppose we're planning a project with three tasks, which we detail below:
Task | Scheduled progress | Actual progress | Budget | Real costs |
|---|---|---|---|---|
#1 | 100% | 80% | $1,000 | $900 |
#2 | 75% | 75% | $500 | $550 |
#3 | 20% | 25% | $500 | $250 |
At first glance, we can see that we're behind schedule on Task #1, and we're ahead of schedule on Task #3. But, as a whole, our schedule performance is pretty hard to figure out, and as a result, it's also hard to determine how our budget is doing. And imagine how much harder this would be if our project had ten, twenty, or even fifty tasks! So, how are we to assess our project's overall health? Earned value management to the rescue!
Let's use our project plan table and the earned value management formulas to crunch some numbers:
-
Planned value:
-
Actual cost:
-
Earned value:
Now that we have these three, let's evaluate our project budget:
-
Cost performance index:
-
Cost variance:
…and our project's adherence to the timeline:
-
Schedule performance index:
-
Schedule variance:
We can already draw some conclusions about our project's health. It's currently over budget ( and a negative cost variance), and it's behind schedule ( and a negative schedule variance). It's not looking good!
We can now estimate just how badly our project is going to end. Let's calculate the remaining cost of completing the project, and subsequently how much the completed project will have cost in total:
-
Estimated cost to complete:
-
Estimated cost at completion:
At this rate, our initial budget of $2,000 will be overrun with $615! Don't feel too bad, though — did you know the Sydney Opera House ended up costing 14 times its original budget?
How is EVM used in project management?
EVM allows a project manager to be both retrospective and proactive. It can explain what went right (or wrong) in a project's past, and it can be used to understand, act on, and influence trends in the project.
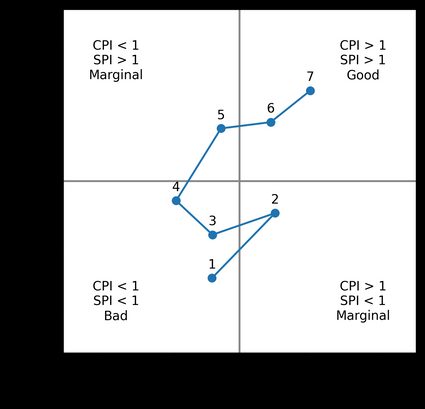
A good practice in project management is to assess the project and its health continually. In fact, EVM tracking is recommended to be part of the standard project review process — you should ideally apply EVM to your project at the end of every milestone it reaches. If you have enough recorded EVM data over your project's lifespan, you can use it to make helpful and insightful visualizations.
For example, take a look at this CPI-SPI graph below. It details the CPI and SPI for a project over seven days. It's easy to see how the project fared over its lifespan: It started over budget and behind schedule, but gradually the project manager corrected the project's course, eventually completing it under budget and ahead of schedule.
FAQs
What is earned value analysis?
Earned value analysis (also known as earned value management) is a methodology to assess an ongoing project's progress. Earned value management and project management are closely related. It's a powerful tool in any project manager's toolbox!
Why do I need earned value management?
When managing a project consisting of multiple tasks with individual budgets and timelines, it's practically impossible to critically evaluate its progress. Earned value management makes it possible, delivering clear indications of the project's health in terms of cost and schedule.
How do I calculate earned value?
To calculate a task's earned value, multiply its progress (as a percentage) with how much you've budgeted for it. A project's earned value is the sum of its tasks' earned values.
When is earned value management required?
Professional project managers are usually required by their company's guidelines to use earned value management. Any project can benefit from some EVM — so while it isn't required when you're doing a small project on your own, it's still a good idea to apply it and learn from the results.
How do I calculate CPI?
Divide your earned value (EV) with the actual cost (AC), i.e., CPI = EV / AC. This equation represents the ratio of value earned to value expended. Larger CPI values are therefore better for you as the project manager.
What is my CPI when my EV is $100 and my AC is $200?
The CPI is 0.5, as CPI = EV / AC. In this example, you've spent twice as much as planned; therefore your cost performance is half as good as planned. Your cost variance will also be negative at (EV-AC)/EV = –50%. You're definitely over budget.