The CPI inflation calculator is a tool to estimate the change in the general level of prices in the United States over different time intervals. It relies on the consumer price index data, which is published by the U.S. Bureau of Labor Statistics (BLS CPI) every month. If you read on, you will learn what the consumer price index (CPI) and the CPI formula are, so you will know how to calculate CPI and CPI inflation. Besides, we will elaborate on some important aspects of CPI in economics.
💡 To learn more about inflation, check out our general inflation calculator.
What is consumer price index (CPI) – the CPI definition
There are several ways to measure how much certain goods cost in a given year. Still, the most broadly applied measure of the overall price level in the United States is the consumer price index (CPI). CPI was designed to reveal how the cost of all purchases by a typical American household has changed over time (the other popular measures are the GDP deflator or the producer price index).
CPI is computed by surveying market prices for a particular basket of goods and services devised to represent the consumption of a typical family of four living in a typical American city.
The market basket used to compute the CPI is a complex amalgam of goods and services that aims to reflect the actual spending patterns for the U.S. population. The Bureau of Labor Statistics (BLS) delegates its employees to about 23,000 retail outlets in 87 cities to obtain the necessary data. Every month it registers around 80,000 prices covering a broad range of items that are converted into a single index measuring the overall level of prices.
How to calculate CPI – the CPI formula
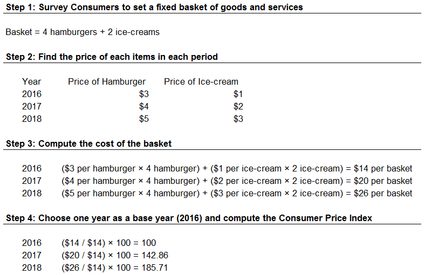
To give you some insight into how statisticians estimate this compact single number, let's reduce the range of purchases of a typical family to only two goods: hamburgers and ice creams. The following four steps represent the main stages of the computation of the CPI index.
1. Fixing the basket
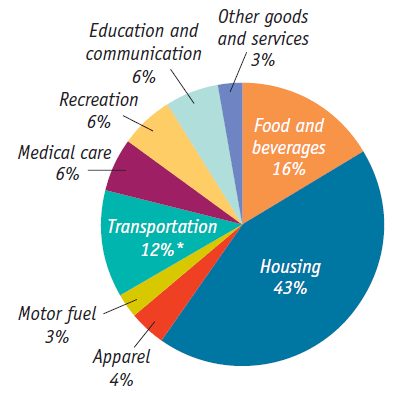
The goods and services included in the basket need to correspond to the real need of a typical consumer. If a product is more important than another, its price needs to be assigned a higher weight. In other words, the basket should aim to reflect the general cost of living. For example, if a typical family consumes more hamburgers than ice cream, the price of a hamburger needs to be included in a higher proportion. In our case, an average household buys 4 burgers and 2 ice creams.
For the sake of reality, the below graph represents the percentage shares of the main types of spending in the US CPI as of December 2008.
2. Determining prices
Prices of the items included in the basket need to be recorded regularly. In our example, the prices of hamburgers and ice creams are stated in three different years.
3. Estimating the basket's cost
The number of items must be multiplied by their price for each period.
4. Computing the index
A base year, designated arbitrarily, must represent a benchmark period (the benchmark index of BLS CPI is the average value between 1982 and 1984). Then finally, we arrive at the point when the following CPI equation can compute the consumer price index:
Consumer price index = Price of a basket of goods and services in the current period / Price of the basket in the base period × 100.
The below table summarizes the CPI calculation procedure for our example.
What is CPI inflation? – how to calculate CPI inflation rate
The inflation rate is one of the most important indicators in economics. As mentioned above, it is the percentage change in the general price level over a period of time. Typically it covers a year; however, with our calculator, you can define the US CPI inflation rate in any arbitrary interval starting from 1913.
The formula applied here is the following:
CPI inflation rate = (CPI in target year - CPI in base year) / CPI in base year × 100
Turning back to our previous example, we can compute the yearly CPI inflation rate for our hypothetical basket in 2017 and 2018.
CPI inflation rate in 2017 = (142.86 - 100.00) / 100.00 × 100 = 42.86%
CPI inflation rate in 2018 = (185.71 - 142.8) / 142.8 × 100 = 30.05%
We can easily track the altering trend in the inflation rate between 1913 and 2018 on the graph below, where the CPI is represented on a logarithmic scale. In this way, the slope of the curve indicates the speed of change in the CPI.
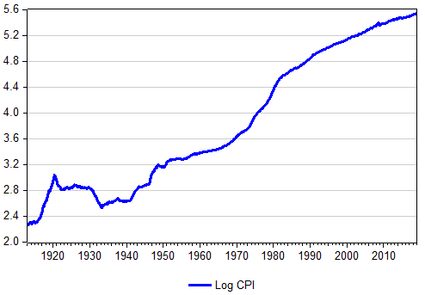
Since the 1940s, the CPI has risen continually; however, its annual percent changes in the last 30 years have been much smaller than those of the 1970s and early 1980s.
How to use the CPI inflation calculator
You can use this calculator to compute the yearly inflation rate, but you can also estimate the cumulative inflation rate for any arbitrary interval from 1913 to today. Besides, you can learn the average yearly inflation rate (by applying the compound annual growth rate formula – see CAGR calculator) in the chosen range.
The first step is to fix the interval by setting two dates: the base year, which represents the year on which the computation is based, and the target year, which is the last year taken into account.
For example, if you are curious about what was the cumulative CPI inflation rate for the hundred years between 1918 and 2018, you need to set the years accordingly:
Base year = 1918
Target year = 2018
Then, you receive the results immediately based on the BLS CPI data also shown on the platform.
CPI inflation rate = (CPI 2018 - CPI 1918) / CPI 1918 × 100 = (251.1 - 15.1) / 15.1 × 100 = 1,563 %
Average CPI inflation rate = ((CPI 2018 / CPI 1918)((1 / number of years) - 1) × 100 = ((251.1 / 15.1)((1 / 100) - 1) × 100 = 2.85 %
Thus, the cumulative CPI inflation rate and the average yearly CPI inflation rate from 1918 to 2018 were 1,563% and 2.85%, respectively.
Consumer Price Index (CPI) vs. CPI inflation
As the calculator's name suggests, here we deal prominently with the CPI inflation rate. Yet to understand its background, we need to take a slight departure and visit the consumer price index.
Before we go into details, it is essential to distinguish between the level of prices and the inflation rate. Although the two phrases are deeply connected, their economic implications differ.
As a starting point, one way to demonstrate the difference between the two indicators is to display them on a graph. In the below illustration, CPI represents the level of prices and CPI inflation embodies the annual inflation rate.
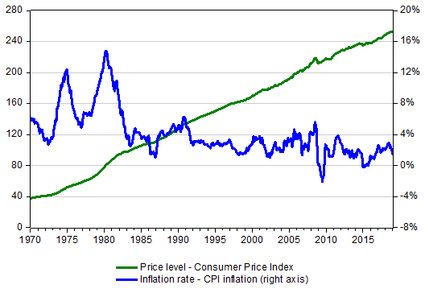
As you can see, over the past 50 years, the price level has been following an upward tendency (the steady increase was interrupted only in 2009 after the onset of the Global Financial Crisis). However, the inflation rate — the rate at which consumer prices change — has been following a different course.
The CPI shows that the price level in the United States in 2019 is more than 6 times higher compared to prices in 1970 (thus, the buying power of the dollar has fallen considerably — see buying power calculator), but how did the substantial increase affect the overall economy?
To get the answer, we need to take into consideration not only the level of prices but also the level of income: what really matters is the real wage – the nominal wage divided by the price level. In other words, we should rather be concerned about the range of goods and services that we can afford from our salaries: if wages increase at the same rate as prices do, we are in the same position regardless of their nominal values.
It follows that the massive surge in prices that has occurred since the early 1970s hasn't made people in the United States poorer: as incomes were raised by a higher rate, real income has become even higher.
Now that we have some insight into the overall level of prices, let's focus on their yearly changes, that is, the CPI inflation rate.
You may think if the price level alone doesn't really matter, the rate of its change doesn't either. Let's briefly scrutinize the US CPI inflation rate in the last 50 years. In the 70s, the US economy was struggling with a relatively high inflation rate that moderated from the 90s. However, as a result of the 2008 financial turmoil and the following recession (negative GDP growth of at least two consecutive quarters – see the GDP growth rate calculator), the inflation rate in several periods became negative (inflation rate below zero percent corresponds to a decrease in the general price level of goods and services that is called deflation).
There is a broad consensus among economists that the rapid rise in the overall price level harms the economy as it implies substantial economic costs. These costs, in general, fall into three main groups:
-
Shoe-leather costs
The high inflation rate is associated with a fast decline in the buying power of the given currency. As a result, people tend to eschew holding that currency and instead proceed with transactions that often imply a considerable economic cost (for example, a frequent and broad exchange of money into a stable currency might require a sizable workload in the banking sector that deprives real resources of an economy).
The expression of "shoe-leather costs" refers to the wear and tear caused by the extra running around that happens when people are trying to avoid holding money. This type of cost is relatively small, with moderately high inflation. It becomes destructive at the time of hyperinflation.
-
Menu costs
In our world, most of the things that you can find in a shop have a listed price. Updating this price has a real cost, called the menu cost. The frequent updates of prices can amplify the adverse effect of menu cost on the economy: the higher the inflation rate, the higher the menu cost. However, with technological improvements, menu costs are becoming less and less relevant since prices can be updated electronically, which requires less workload.
-
Unit-of-account costs
We make economic decisions and conduct our businesses based on the value of the dollar (or any other specific currency). In other words, the value of material things (for example, goods, services, labor, income, expenses, profits, liability, debt, or savings) are measured and compared in a specific currency. This function of the dollar is called the unit-of-account. Inflation weakens such a feature of the currency, as the rapid decline of the purchasing power of a dollar imposes uncertainty and reduces the quality of economic decisions.
To sum up, what really matters for the economy as a whole is not the overall price level but the inflation rate, the rate how the general price level changes.
On the other hand, deflation is not a welcomed phenomenon either. It may not only delay consumption and investment decisions, but it might increase the real debt burden of loans, thus further worsening the financial position of people in debt. Deflation is particularly harmful when a considerable number of households are indebted, for example, as it happened after the 2008 financial crisis. In this situation, the real values of loans increase, further hindering economic recovery.