T Table
T-score table is categorized into two types based on the direction of the critical value (one tail or two tails). The names of its types are given below:
- One Tailed T-distribution Table
- Two Tailed T-distribution Table
The one-tailed t-distribution and two-tailed t-distribution tables have degrees of freedom up to “1000”, a significance level between “0 to 1”, and a confidence level up to 99.9%.
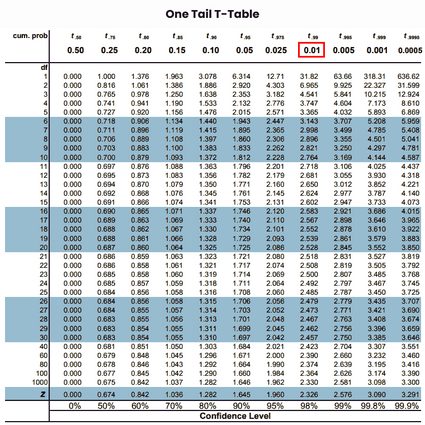
One Tailed T Distribution Table
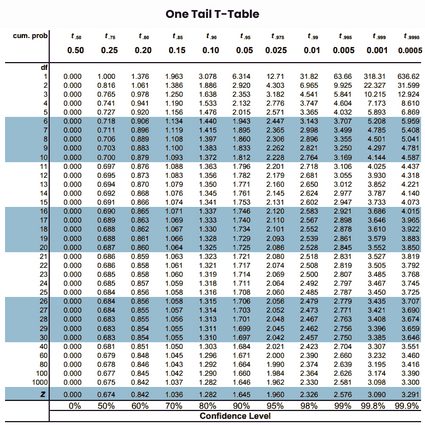
One Tail t table is used to find critical values in one direction (left or right tail) to perform a one-tail t-test or hypothesis test. It provides the probability values of a t-statistic that falls within a specific one-sided area of the t-distribution, based on the given degrees of freedom and significance level (alpha).
The detailed one-tail t table is given in the below picture with the proper representation of degrees of freedom, confidence level, and alpha values.
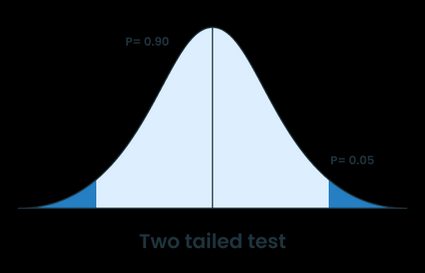
Two Tailed T Distribution Table
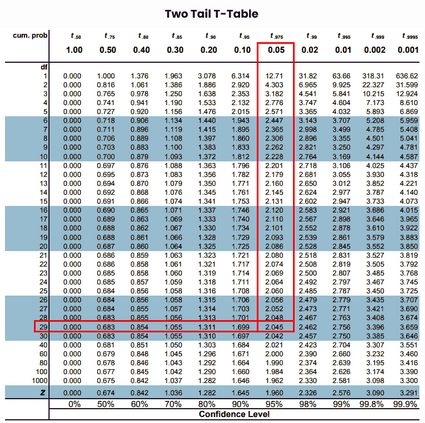
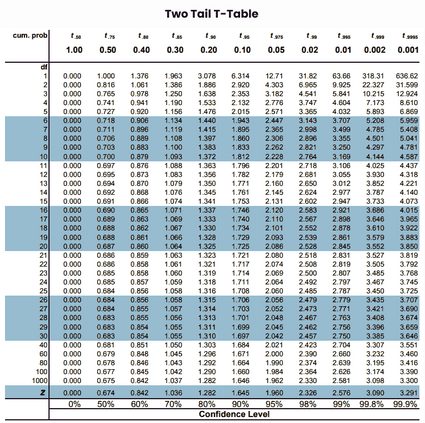
Two Tail T Table is also used to determine critical values for a t-distribution to performing hypothesis testing or t-tests, but it is used for the two tail tests. It gives the rejection region to select or reject the null hypothesis for a test, by comparing test statistic values in positive and negative directions for the given deviation values.
This table listed t-values for various significance levels (alpha), degrees of freedom, and confidence levels. For a detailed overview of two tail tables see the below picture.
To read the t-score table and find the critical t-value. First, you need to know about the components of the t-distribution table and one-tailed & two-tailed tests.
One Tail vs Two Tail Test
-
Purpose:
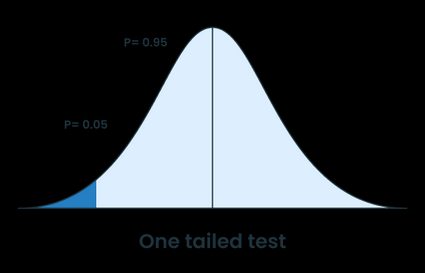
One-Tailed Test: Used to check whether the sample mean is significantly higher or lower than the population mean (i.e., in one specific direction).
Two-Tailed Test: Used to determine if there is a significant difference between two means, regardless of direction (i.e., higher or lower).
-
Direction of Testing:
One-Tailed Test: Tests for significance in one direction only.
Two-Tailed Test: Tests for significance in both directions.
-
Critical Value Determination:
One-Tailed Test: Uses a one-tailed t distribution table (or calculator) to find the critical value, based on degrees of freedom (df) and significance level (alpha).
Two-Tailed Test: Uses a two-tailed t distribution table, also based on df and alpha, to determine the critical value.
-
When to Use:
One-Tailed Test: When the research hypothesis predicts a specific direction of the effect (e.g., greater than or less than).
Two-Tailed Test: When the hypothesis does not specify a direction, only that a difference exists.
Components of T Table
- Degrees of freedom: The degrees of freedom show the number of independent values that change without breaking the constraints in analysis. The degrees of freedom will be represented by “(df)” and placed along the left column of both tables (one or two tails).
- Significance Level (α): It is the probability used to reject or select the null hypothesis. It is listed at the top of the table and is also known as alpha level. The common alpha levels used for the t-test are 0.01, 0.05, and 0.10.
- Number of Tails: Note whether the test is one-tailed or two-tailed by viewing your data. Because t table is categorized based on the number of tails or alpha level. The α-levels start from “0.50, 0.25, 0.20, 0.15…” in the one-tail t table. But in a two-tail t score table it starts from “1.00, 0.50, 0.40, 0.30…”.
See the below examples to calculate the t value for one tail & two tails by using the respective t statistics table. These examples are solved with detailed steps that help to understand how to use the t table & find the t-critical value.
Example 1: Find the t value for an alpha level of 0.01 and a sample size is 25 to perform a one-tailed t-test.
Solution:
Step 1: First, we select the table according to the test. Here, data is given for one-tailed t test so we will select the one-tail t distribution table.
Step 2: Calculate the degrees of freedom of given data.
The degrees of freedom can be found by where is the sample size. For instant results use our degrees of freedom calculator 🇺🇸.
Step 3: Note the value of -level from the given data: = Significance level = 0.01
Step 4: Now, highlight the alpha value at the top of the selected t-score table. Our alpha level is “0.01” then we map on one tail t table.
Step 5: Now, map the degrees of freedom of given data on the leftmost column of the critical value table.
Step 6: Finally, note the intersection of “df” and alpha values from rows & columns of the t table chart.
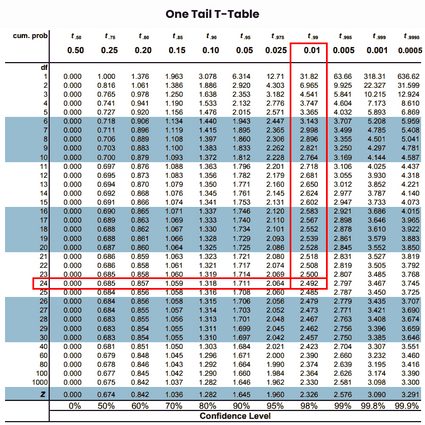
Thus, the required t-critical value is “2.492” by using one tail t-value table.
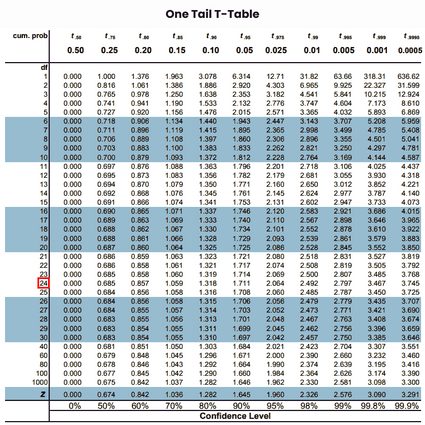
Example 2: Calculate the t value when performing the two-tailed t-test, if the alpha level is 0.05 and the sample size is 30.
Solution:
Step 1: First, we will select the table according to the test. Here, given data for a two-tailed t test then we selected the two tail t distribution table.
Step 2: Find the degrees of freedom of given data. The degrees of freedom can be found as:
Step 3: Note the value of -level from the given data: = Significance level = 0.05.
Step 4: Now note the intersection of “df” and alpha values from rows & columns of the t table chart.