The relative strength index calculator (RSI) is an excellent trading tool that can tell you when a stock is overbought and ready for a price decline or undersold and prepared for a price increase. The RSI indicator can help you know when to buy or sell a stock. This article will cover what the relative strength index is, the RSI formula, and how to use this incredible RSI calculator.
What is the relative strength index?
The RSI is a trading momentum indicator that averages the price gains and losses during a specific trading period to see if the stock is more likely to keep going up/down or change its direction.
Bonds, commodities, and stocks increase and decrease in price following business cycles of economic growth and shrinkage. We can identify the point where the cycle changes from the positive side to the negative side (or vice versa) by measuring momentum, allowing you to sell the business when it is about to crash.
The daily RSI indicator measures momentum, showing if a reversal in price is about to come or the current trend can stay longer. It considers the specified period's daily stock gains and losses. Then, it provides a value between 0 to 100, with the equilibrium level at 50.
In trading, whenever the RSI is over 50, the momentum is positive, and the price will likely increase or continue increasing. Contrarily, when the RSI is under 50, it shows that the security is losing momentum, and the price is likely to decrease or continue decreasing. Of course, the further we go out of the equilibrium point, the trend reversal becomes more obvious to happen.
How do you interpret the relative strength index?
For a 14-day period RSI, the upper and bottom levels will be:
-
RSI = 70, meaning that the stock is overbought for any RSI above this level, and the upward price trend is about to reverse, causing losses if you do not sell.
-
RSI = 30, indicating that the stock is oversold for any RSI below this level, with the downward price trend ready to increase, generating profits if you buy.
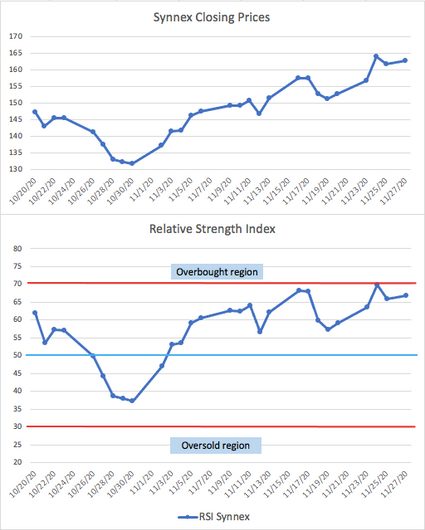
Between October 30th, 2020, and November 12th, 2020, several investors sold their Synnex positions, thinking that the stock was about to crash because it went up too much. The stock made a return of 11.46% during that period. Do you want to know how to get a stock's profit return? Check the stock calculator.
But a look at the relative strength index on November 12th (RSI = 57.64) showed that the stock still had the momentum to keep rising its price (RSI<70, not underbought). Thus, an investor using our relative strength index calculator would have kept holding the stock even until the current last trading day, in which the price reached 162.82, or a 23.69% positive gain — almost a double return on investment.
Let's take a look at an example. See the following picture:
What is the RSI formula?
Investors calculate the RSI indicator using the average changes in closing prices during the specified period, accordingly to the following formulas:
Remember you can always use the average calculator to help you with the mathematics. Furthermore, stands for relative strength, and we calculate it with the average gains and average losses during the specified period (typically 14 days when we use RSI for trading).
See the following example:
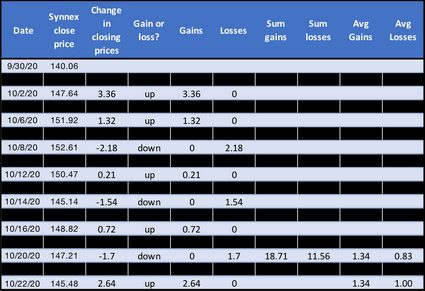
Note we take the difference in price between subsequent days, , and if we see the result is positive or negative. If,
- , we store the difference in the Gains column and a 0 in the Losses column.
- , we store the difference in the Losses column and a 0 in the Gain column.
Afterward, we sum the values from each column:
(note we use absolute values)
and average them by 14 data points (notice we need 15 prices for getting 14 values of price change):
Consequently, and by using our cool relative strength index calculator:
Look at the chart above; it shows the same RSI for this stock at its beginning.
The RSI formula — further calculation
Congratulations, you got your first RSI for a stock. Now, we will build the curve to analyze RSI divergence with price.
Considering your oldest data point as the 1st closing price, you will get the first RSI on the 15th closing price (see table above). Then, for calculating the 2nd RSI point, you will need an extra closing price.
where:
- represents the new average.
- indicates the previous average.
- shows the change in the current price.
This procedure applies to gains and losses. You can follow the chart above for October 21st and 22nd. See the following example for October 21st.
Then, the new RS:
You can verify these values in our relative strength index calculator and the RSI chart above.
Real example of the RSI indicator and RSI divergence on stocks
Since this is a momentum indicator, we need to combine it with other trading indicators to get reliable buy/sell signals. In this case, we will use the RSI together with the simple moving average (SMA) of 7, 20, and 50 days.
As explained in the moving average calculator, the SMA's purpose will be to show a price trend reversal based on the change of RSI trend. When prices (light blue line below) cross the SMA, a price trend change might be incoming. The older the SMA we cross, the more significant the new trend change.
Let's check the SPY ETF during March 2020:
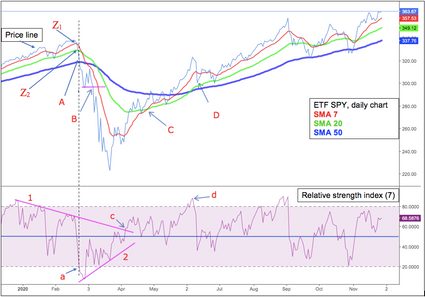
The maximum value (338.5 USD) occurred on February 19th, 2020, and from that point, it started to go down, causing millions of dollars in losses for investors. Would it have been possible to avoid all the losses? Together with the 7-SMA, 20-SMA, and 50-SMA, our relative strength index calculator says yes.
Before starting, you must notice that we use RSI (7 days) with upper/lower 80-20 bands.
-
Check trend line in the RSI section. Notice that it has a downward tendency; meanwhile, the price rises: this event is a bearish RSI divergence. On the other hand, if the RSI shows more momentum with a price still going down: we call it a bullish RSI divergence. In any case, it shows that the current price trend is weakening and about to reverse.
-
See how the price line crosses below lines 7-SMA and 20-SMA in point and point , respectively. Note also the RSI indicator was below 50 at that time. There we had our first sell signal.
-
Third, we reach the oversold area (see in the RSI chart), meaning that the trend might change soon, but as we said, we need price confirmation too. Now, check point . Price breaches the long-term 50-SMA, indicating the selling will continue. Here we fail to get price confirmation. Not a buy signal yet.
See the price chart, purple horizontal line where the price arrives the first time, bounces, and then goes through it. The very fact that it breaches the line indicates a crash. Here, at 297 USD, we definitely must have sold our positions.
-
By keeping an eye on the RSI, we noticed that it has higher low points represented by trend line . Then, we reach and pass the equilibrium zone meaning the price has upward momentum. After that, we notice how the RSI breaks the old trend line extension in point , indicating that the downward loss of momentum, which started at the beginning of the year, might have ended. We also see how the price starts increasing again.
-
We can notice that at point , the short-term 7-SMA crosses the medium-term 20-SMA, confirming the buy signal at 278 USD.
-
Finally, in the RSI chart, at point , we reach the overbought section indicating that a reversal in the trend might come, and again, it does. However, at point , the price does not cross the 20-SMA like before, indicating a false selling signal.
In conclusion, by using both indicators, we would have avoided the biggest crash of the last ten years and enjoyed all the bullish market returns since then. This is why we built our relative strength index calculator!
FAQs
What is the relative strength index?
The relative strength index is a momentum indicator that averages prices over a period. Investors use it with price indicators because it provides reliable stock buy or sell signals.
Is an RSI over 70 good or bad?
An RSI value over 70 indicates that the price trend might be about to reverse and generate losses if you buy. However, it depends on the price timeframe you are checking: An RSI over 70 when using monthly prices shows much more probability of price trend reversal than an RSI over 70 using hourly prices.
Is an RSI below 30 good or bad?
An RSI value below 30 indicates that the price trend might be about to reverse and generate profits if you buy. However, it depends on the price timeframe you are checking: An RSI below 30 when using monthly prices shows much more probability of price trend reversal than an RSI below 30 using hourly prices.
How do I calculate RSI?
To find the relative strength index:
-
Get the historical values for the last 14 days.
-
Calculate price change between subsequent day prices. Let's say the price on March 5th minus the price on March 4th.
-
Separate the positive price change from the negative ones.
-
Average positive price changes. Do the same for the negative ones.
-
Calculate relative strength (RS) by dividing the average of positive price changes by the average of negative price changes.
-
Obtain RSI by subtracting 100/(1 + RS) from 100.