Welcome to Omni's graphing inequalities on a number line calculator, where we'll take on some linear inequalities and see how to plot them on the number line. And once we see how to deal with one, we'll add some more to the pile and get to graphing systems of inequalities. The resulting number line graph will be a simple tool to find values that satisfy all given conditions: something that our graphing compound inequalities calculator provides as well.
🙋 Our graphing quadratic inequalities calculator helps you solve quadratic inequalities by graphing parabolas.
Linear inequalities
Inequalities in math are numerical relations that describe where a value lies with respect to some other one. By default, there are four of them: they say whether the first number is:
- Smaller than (<);
- Smaller than or equal to (≤);
- Greater than (>); or
- Greater than or equal to (≥);
the second number. For instance:
123 < 216
states that 123 is smaller than 216.
Such relations seem straightforward when done with numbers. Well, fair enough: it gets a bit trickier with negative numbers or decimals, but in the end, it still boils down to a few simple rules. It gets more interesting if we decide to include a bit of algebra and introduce variables.
We know that equations are formulas that some unknown variables have to satisfy. Inequalities are similar. However, instead of being specific (e.g., saying that multiplying the number by some value will give a concrete result), they give a rough idea of where the result lies. For instance:
x - 10 > 13
states that subtracting 10 from the value of x will always give something greater than 13. It may give 15 (for x = 25), it may give 134 (for x = 144), or any other crazy number we come up with. As such, inequalities usually give a range of possible results rather than a single one.
Linear inequalities are those with variables only in the first power. They cannot have them in higher exponents, in the denominator of a quotient, under a cube root, inside a logarithmic function, etc. Below, you can find several examples of linear inequalities.
-
x ≥ 0 -
-2 < 2x + 7 -
4x - y ≤ z - 2x + 1
Note how more variables can still give linear inequalities as long as they satisfy the restrictions above. However, we'll focus here only on those with a single one, which we'll denote by x (as in the graphing inequalities on a number line calculator). Therefore, we can limit ourselves to one-dimensional drawings and studying number line graphs.
But that, folks, is a topic for a separate section.
How to graph inequalities
Before we see how to graph, say, the inequality of greater than or equal to on a number line, let's spare a few words about the number line graph itself.

We can order all real numbers and mark them on an infinite axis called the number line. In essence, the line tells us where one value lies with respect to others: is it larger (to the right) or smaller (to the left) of something else? If we recall the relations mentioned in the first section, it indeed seems like the perfect tool for representing inequalities visually.
The first lesson on how to graph inequalities is: you have to solve them first. To be precise, we need to go from expressions like:
3x + 1 ≥ 7
to something of the form:
x ≥ 2
i.e., a single x followed by an inequality relation and a number.
Our topic here is the graphing compound inequalities calculator, so we'll skip instructions on how to solve such things. Let us only briefly mention that we do it the same way we deal with ordinary equations, with the exception that we need to change the inequality sign whenever we multiply or divide by a negative number.
Let's assume that we obtained something like x ≥ 2 and see how to graph such inequalities. The basic instructions are as follows:
- Find the value from the inequality on the number line graph.
- Draw a line from that point upwards and to the:
- Left for
<and≤; or - Right for
>and≥.
- Left for
- When going with the line up, draw it:
- Slanted for strict inequalities (i.e.,
<and>); or - Straight for non-strict inequalities (i.e.,
≤and≥).
- Slanted for strict inequalities (i.e.,
Note: there exists another popular way for distinguishing strict and non-strict inequalities (point 3 above). Namely, we draw a small circle centered at the point from the inequality and either:
- Keep the circle empty for strict inequalities (i.e.,
<and>); or - Fill it for non-strict inequalities (i.e.,
≤and≥).
Here, we use the variant in point 3 above since it's what Omni's graphing inequalities on a number line calculator uses.
Remember that the number line graph is a representation of an axis that is infinite in both directions. As such, the linear inequality plots also are infinite (but in one direction). Therefore, they mark sets of all numbers from minus infinity to some value (for < and ≤) or from some value to plus infinity (for > and ≥).
Now that we know how to graph inequalities on a number, what do you suspect our next move should be?
That's right: graph even more of them.
Graphing systems of inequalities
As mentioned in the first section, linear inequalities give us a rough idea of what values our variable admits. Sometimes, we might want to limit the possibilities even further, so we introduce yet another inequality and demand that the variable satisfies both of them. And if we're still unsatisfied, we can have yet another. And another.
Systems of inequalities (like systems of equations) are lists of inequalities that we want all to be true simultaneously. They are also called compound inequalities. You may want to check out our system of equations calculator, just to broaden your knowledge.
Obviously, introducing a new inequality may ruin the first one or change nothing. For instance, the system:
x < 3, x > 6
has no solutions. On the other hand, in the system:
x < 3, x < 6
the second inequality is pointless since every number smaller than 3 is automatically smaller than 6.
In essence, graphing systems of inequalities is easy. We simply draw them one by one on the same number line graph. Mind you, we recommend using different colors so that you don't mix them up. Child's play, wouldn't you say?
Reading off the result is more tricky. To find what numbers satisfy all the relations simultaneously, we need the values that fall under each drawn line. Usually, we shade the area under the drawn lines (again, with different colors for each) and check where all the colors meet. Also, remember that the greater than or equal to on a number line admits the value it starts with, so make sure to distinguish between strict and non-strict inequalities when you consider the limit points of your solution set.
Well, reading about drawings and colors might not be enough to explain the topic properly. Why don't we try out the graphing inequalities on a number line calculator and put our crayons to good use?
Example: using the graphing inequalities on a number line calculator
Let's see how to graph inequalities in practice by drawing the number line graph for the following system of inequalities:
x < 2, x ≥ -1
However, before we grab the crayons, let's see how easy the task is with Omni's graphing inequalities on a number line calculator.
Firstly, we tell the tool how many inequalities we have. In our case, there are two, so we select 2 under "Number of inequalities". That will show two sections below corresponding to the expressions. For the first, we choose the relation at hand, i.e., "smaller than (<)", and input the value 2 underneath. Similarly, for the second, we choose "greater than or equal to (≥)" and input -1.
The moment we write the second number, the graphing compound inequalities calculator will show us a graph underneath. Note how the tool also spits out the solution to your system of inequalities in interval notation below the graph.
We have a inequality to interval notation calculator, you may wanna give it a try as well.
Now, let's describe how to graph the inequalities ourselves. We begin by drawing a number line and marking the two points given by the inequalities: in our case, they are 2 and -1. The first inequality, i.e., x < 2 has a strict relation, so according to the instructions from the second section, we draw a slanted line from 2 and go left (because it's a "smaller than" relation). For x ≥ -1, we start from the point -1, draw (with a different color) a straight line (because it's a non-strict inequality), and go right (because it's a "greater than or equal to" relation).
All in all, we obtain the following number line graph:
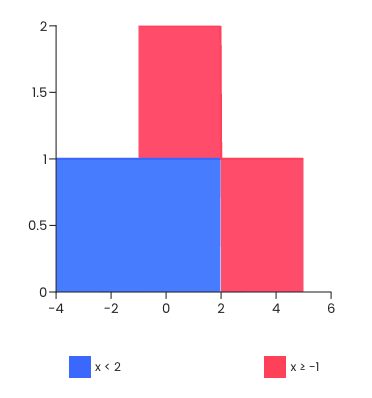
We see that the two colors overlap in between -1 and 2. Recall that for -1, the greater than or equal to on a number line includes the endpoint -1, while for 2, we exclude that value. Therefore, the solution set is the interval [-1, 2) (i.e., including -1 but excluding 2).
Remember that Omni's graphing inequalities on a number line calculator allows up to three compound inequalities, so we can add one more to the system above. Make sure to play around with the tool and check out other arithmetic calculators we have on offer.
FAQs
How do I graph solutions to inequalities on a number line?
To graph solutions to inequalities on a number line, you need to:
- Solve the inequality, i.e., transform it into, e.g.,
x ≥ a. - Find the value from the inequality on the number line.
- Draw a line from that point upwards and to the:
- Left for
<and≤; or - Right for
>and≥.
- Left for
- When going with the line up, draw it:
- Slanted for strict inequalities (i.e.,
<and>); or - Straight for non-strict inequalities (i.e.,
≤and≥).
- Slanted for strict inequalities (i.e.,
- Enjoy your solutions graph.
How do I graph compound inequalities on a number line?
To graph compound inequalities on a number line, you need to:
- Solve the inequalities, i.e., transform them into, e.g.,
x ≥ a. - Find the value from the first inequality on the number line.
- Draw a line from that point upwards and to the:
- Left for
<and≤, or - Right for
>and≥.
- Left for
- When going with the line up, draw it:
- Slanted for strict inequalities (i.e.,
<and>); or - Straight for non-strict inequalities (i.e.,
≤and≥).
- Slanted for strict inequalities (i.e.,
- Repeat points 2-4 for consecutive inequalities using different colors.
- Find the area where all the colors meet.
- That area marks the solution set to your compound inequalities.
How do I graph inequality equations on a number line?
To graph inequality equations on a number line, you need to:
- Solve the inequality, i.e., transform it into, e.g.,
x ≥ a. - Find the value from the inequality on the number line.
- Draw a line from that point upwards and to the:
- left for
<and≤; or - right for
>and≥.
- left for
- When going with the line up, draw it:
- Slanted for strict inequalities (i.e.,
<and>); or - Straight for non-strict inequalities (i.e.,
≤and≥).
- Slanted for strict inequalities (i.e.,
- Enjoy your solutions graph.
How do I read inequalities on a number line?
To read inequalities on a number line, you need to:
- Find the starting point of a shaded area.
- Determine the direction that area goes from the point:
- For left, the inequality is
<or≤; and - For right, the inequality is
>or≥.
- For left, the inequality is
- Check how the shaded area begins:
- For a slanted line, the inequality is
<or>; and - For a straight line, the inequality is
≤or≥.
- For a slanted line, the inequality is
- Choose the relation that satisfies steps 2 and 3 simultaneously.
- Write the inequality with the relation from step 4 and the point from step 1.
- Enjoy the result you read on the number line.