A No-Hitter is a 1-in-858 shot. So why does MLB see so many?
• Sports
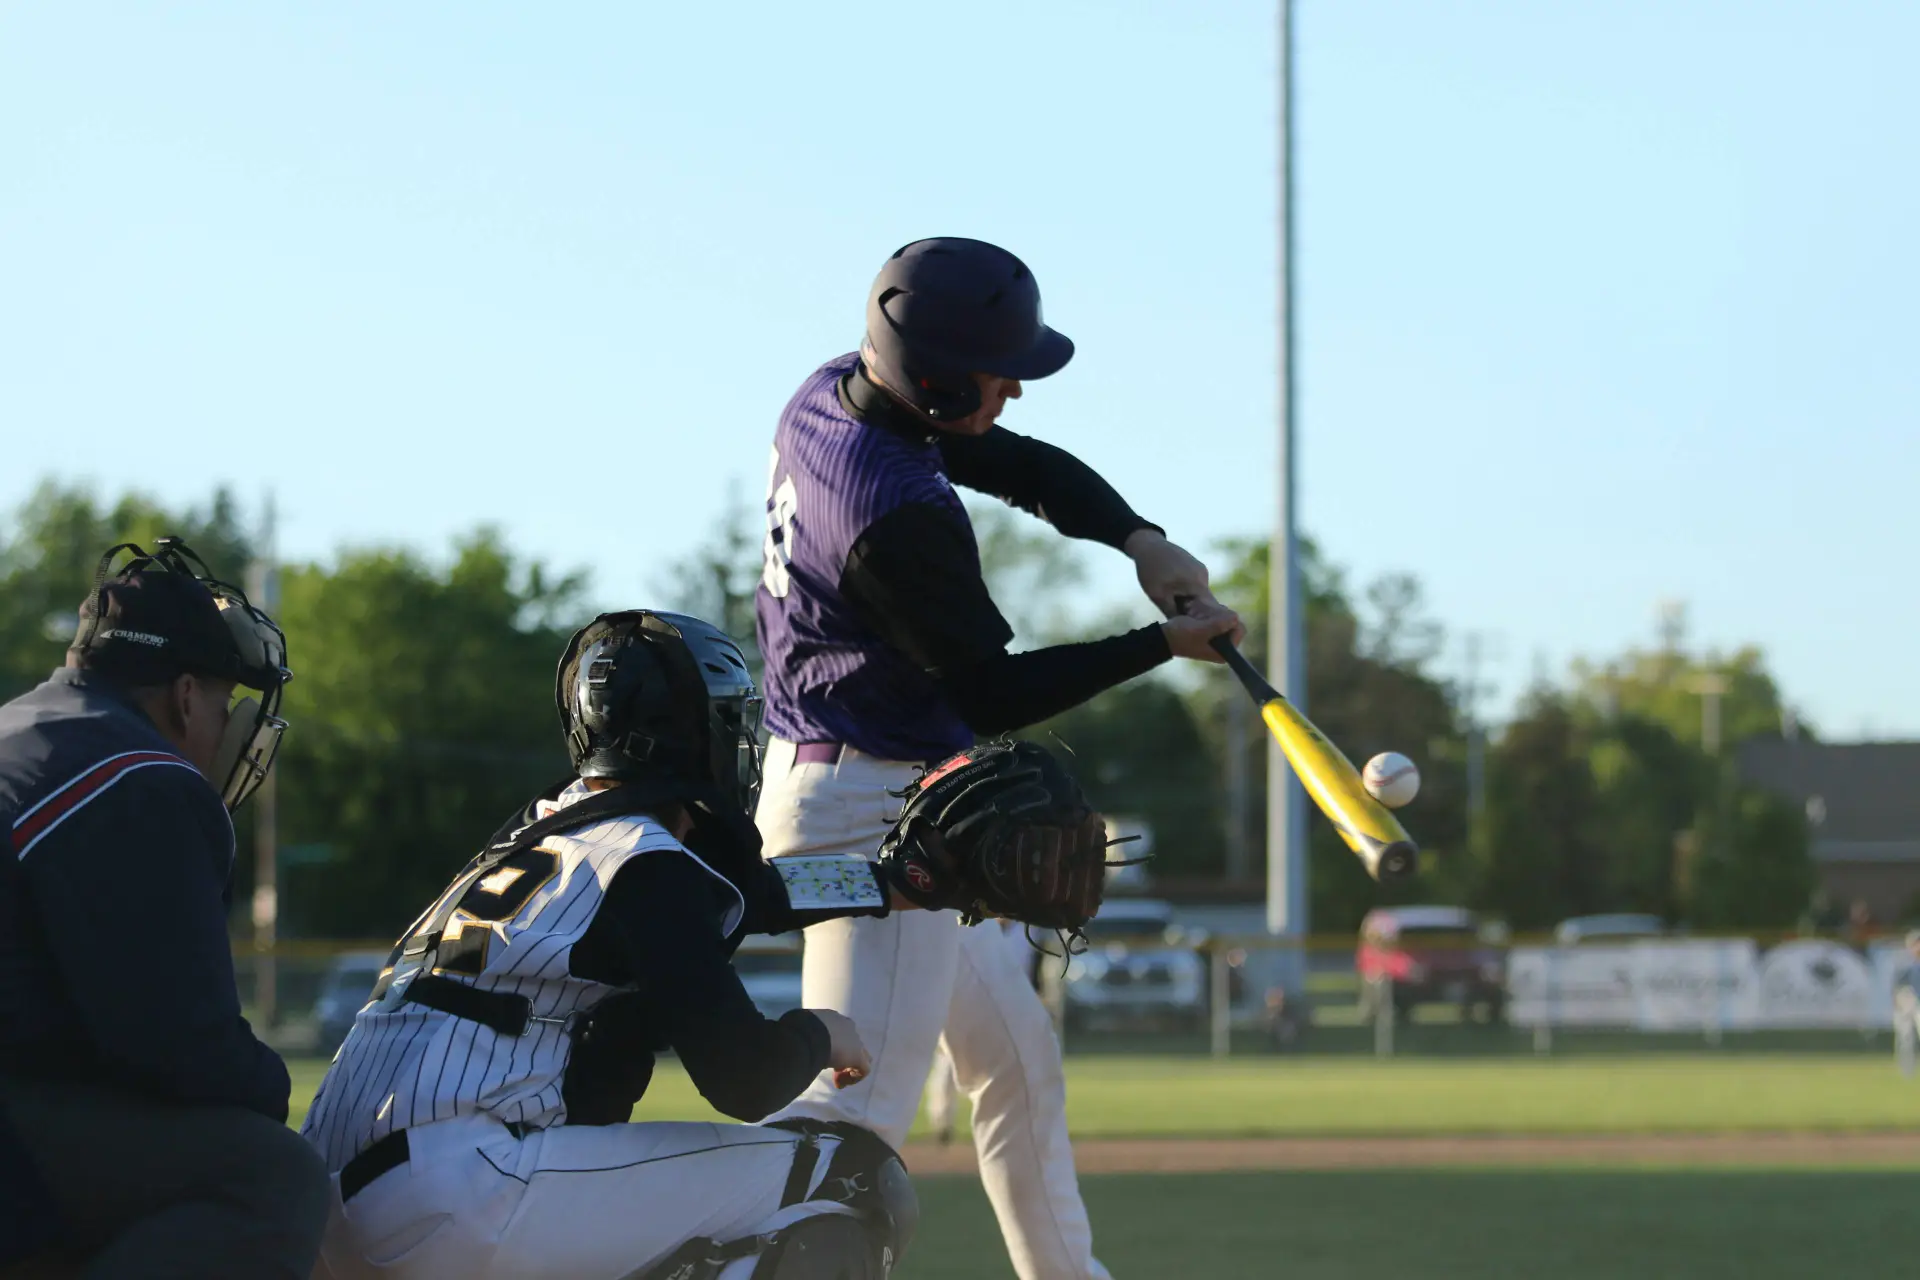
Based on how often big-league batters got hits in 2026, any given team should go hitless for a full game about once in 1715 games. Since every game gives two teams the chance, that works out to one no-hitter roughly every 858 games. Yet MLB has recorded 186 official no-hitters since 1960, against 114 expected by our model. The question came back on October 3, when Tampa Bay's Drew Rasmussen held the Yankees hitless for around 7 innings in ALDS Game 1 before Austin Wells doubled with two outs in the eighth.
Key takeaways
- At 2026 hitting levels, the expected chance that a team is no-hit in a game is 1 in 1715.
- In the 2010s, the latest full decade, our model expected 21 no-hitters. MLB recorded 39, almost twice as many.
- The widest gap came in the 1990s (31 actual vs 13 expected). In the 1980s, reality fell short of the model (13 vs 15).
- Only three no-hitters have ever been thrown in the postseason, in 1956, 2010 and 2022.
Expected vs actual, decade by decade
In six of the seven decades since 1960, MLB saw more no-hitters than the odds predict, though the 2000s were almost even. Over the whole span, actual no-hitters beat expected ones by 63%.

How the model works: 27 outs, zero hits
A no-hitter needs 27 outs without a hit. Walks and hit batters don't end it, so the model counts only plate appearances that end in a hit or an out.
- Find the hit rate per out. For each season, q is league hits divided by hits plus outs, with outs = at-bats - hits + sacrifice bunts + sacrifice flies. In 2026, q was 0.241.
- Chain 27 outs together. The chance that a team gets through a whole game without a hit is (1 - q) to the 27th power. For 2026: 0.759 to the 27th power ≈ 0.00058, or 1 in 1715.
- Multiply by games. Each game has two teams batting. That gives about 2.8 expected no-hitters for 2026's 4858 team-games.
The simpler version, using batting average in place of q, gives even fewer: 16 expected in the 2020s instead of 17.5. That's because batting average treats sacrifices as if they didn't happen, which makes outs look scarcer than they are.
Why reality beats the model
The model pictures an average pitcher facing an average lineup every night. Real games aren't like that. Because the chance is a 27-step chain, small edges compound: a pitcher who allows hits on 18% of outs instead of 24% is nearly eight times as likely to finish hitless. His best days add far more no-hitters than his off days take away, so averaging everyone together undercounts.
The gap isn't steady. It peaked in the 1990s, when 14 no-hitters came in 1990 and 1991 alone. It nearly vanished in the 2000s (15 actual, 14 expected), and the 1980s fell below the model. The last two seasons ran short too: no no-hitters in 2025 against 2.7 expected, and one so far in 2026 against 2.8.
The model also ignores ballparks, platoon matchups, extra innings and the shorter seven-inning doubleheader games of 2020 and 2021.
No-hitters in the postseason
Only three postseason games are official no-hitters: Don Larsen's perfect game in the 1956 World Series, Roy Halladay's no-hitter in the 2010 NLDS, and the Astros' combined no-hitter in Game 4 of the 2022 World Series, started by Cristian Javier. A short October schedule and stronger lineups help explain why so few happen.
Methodology
Expected no-hitters use league batting totals for every regular season from 1960 to 2026: games, at-bats, hits, sacrifice bunts and sacrifice flies. The 1960-2025 totals come from Retrosheet game logs, and 2026 comes from Baseball-Reference (data through the end of the regular season). Strike-shortened 1981, 1994 and 1995 and the 60-game 2020 season use the games actually played. The 2020s cover 2020-2026 only.
Actual no-hitters follow MLB's official definition: a complete game of at least nine innings with no hits allowed, including combined no-hitters. Since MLB's 1991 rule change, games shortened by weather, road losses of eight innings and seven-inning games don't count. We excluded 11 such hitless games from 1960 to 2025. Counts are regular season only and are listed in MLB's no-hitter list. The postseason count comes from the same official records.
Most Read



loading
Related Articles
Loading